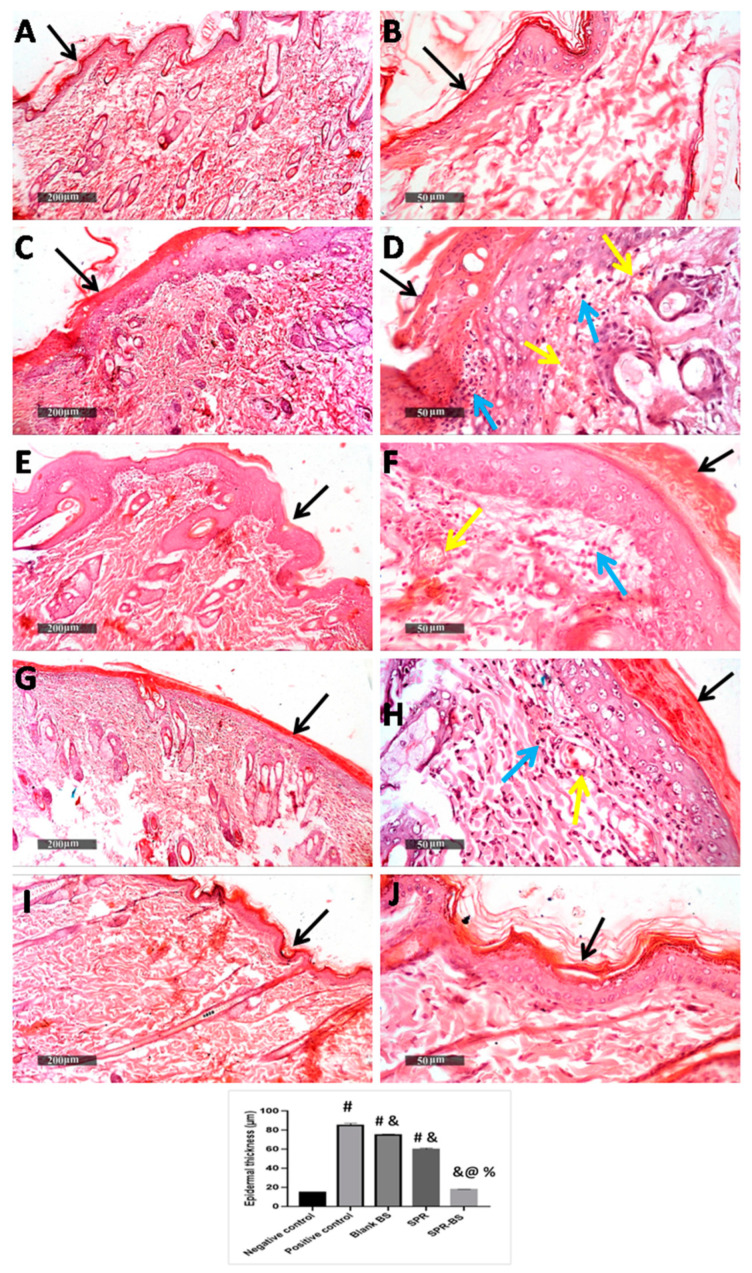
Figure 7.
Photomicrograph of skin samples from UVB irradiated skin rats. (A,B) showing normal histological features of non-UV irradiated control group, (C,D) for UVB irradiated group, (E,F) for Blank BS treated group, (G,H) for SPR suspension treated group and (I,J) for SPR-BS treated group. (H,E) stain. Epidermis (black arrows), inflammatory cells (blue arrows), Congested BVs (yellow arrows). Values are expressed as mean ± SD. # significant from negative control group. & Significant from positive control group. % Significant difference from blank BS. @ significant from SPR suspension. Significant difference was conducted at p < 0.0001.

