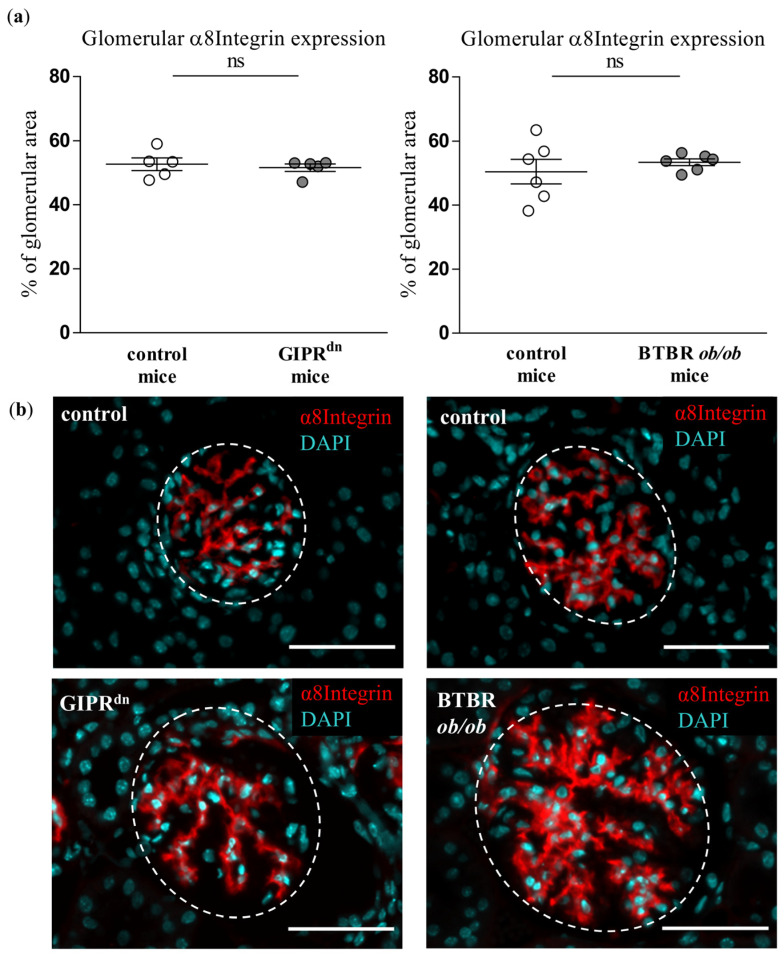
Figure 4.
Analysis of α8Integrin in diabetic kidney disease models. (a) Automatic histological evaluation of α8Integrin-positive area in glomeruli of GIPRdn mice (left, diabetes mellitus type 1 model) and BTBR ob/ob mice (right, diabetes mellitus type 2 model) compared to their corresponding healthy control mice Scatter dot plot with means and SEM, ns: not significant, n = 5–6. (b) Representative images of histological kidney sections stained for α8Integrin (red) and the nuclear marker 4′,6-diamidino-2-phenylindole (DAPI, cyan). The dashed line borders the glomeruli. Scale bar: 50 µm.

