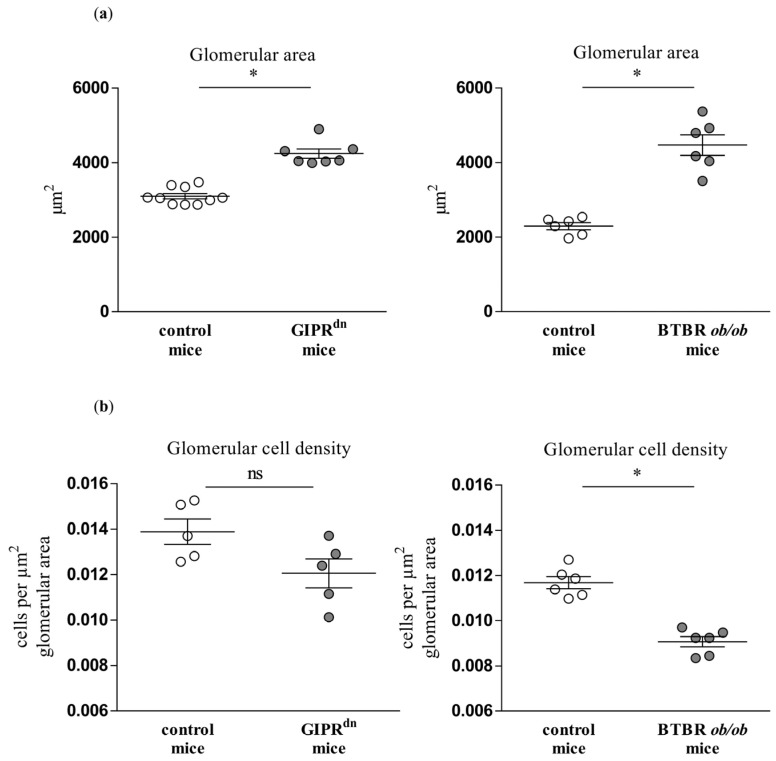
Figure 6.
Analysis of glomerular morphology in diabetic kidney disease models. Automatic histological evaluation of glomerular area (a) and glomerular cell density (b) in kidneys of GIPRdn mice (left, diabetes mellitus type 1 model) and BTBR ob/ob mice (right, diabetes mellitus type 2 model) compared to their corresponding healthy control mice. Scatter dot plot with means and SEM, * p < 0.05, ns: not significant, n = 5–10.

