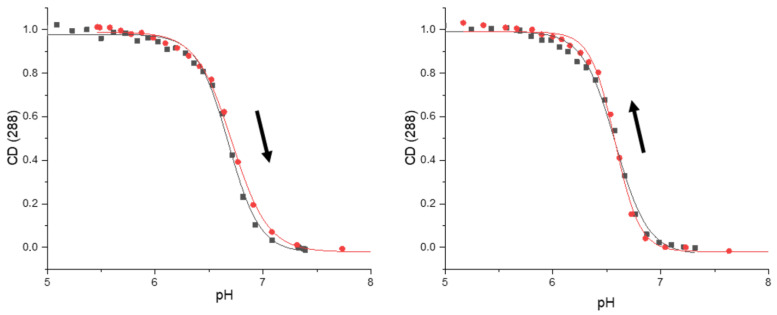
Figure 5.
Representative pH-dependent denaturation/renaturation of i-DNA: normalized changes of ellipticity at 285 nm in the course of potentiometric titrations of bcl-2 performed in the absence (black points and curves) and in the presence (red points and curves) of 20 µM IMC-48. For the detailed conditions, cf. Table 2 legend. (Left) alkali (denaturing) titration; (right) acid (renaturing) titration. The arrows indicate the denaturing/renaturing processes.

