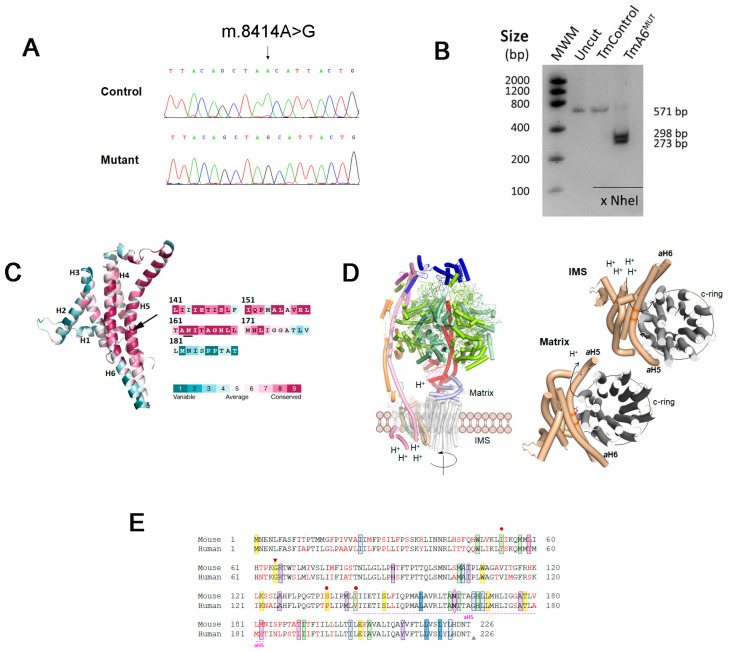
Figure 1.
Analysis of m.8414A>G mutation in mt-Atp6 gene and protein: (A) chromatogram showing the m.8414A>G mutation within the mt-Atp6 gene in mutant BcTMP11.1 cells; (B) RFLP analysis of the mutation in transmitochondrial mutant (TmA6MUT) and control (TmControl) cells. The presence of the mutation creates a recognition site for NheI; (C) ConSurf analysis of FoF1 ATP synthase subunit a (MT-ATP6) from Mus musculus shown as cartoon colored according to the conservation score calculated by ConSurf server (left). The protein is folded in six transmembrane α-helixes connected by loops. The N163 (represented with sticks, black arrow) is an exposed residue located in a highly conserved region of helix aH5. As shown in the aH5 sequence (right), N163 is a highly conserved amino acid; (D) structure of mitochondrial ATP synthase (left) and interaction of subunit a with the c-ring (right). Left: Cartoon representation of subunit composition of the bovine ATP synthase monomer (PDB 6zpo). The catalytic subunits α and β (upper part) are lemon yellow and pale green, respectively. The asymmetrical central stalk subunits ƴ, δ and ε are red, light blue and violet, respectively. The peripheral stalk subunits OSCP, F6, b and d are blue, violet, pink and orange, respectively. The membrane domain composed of the c-ring in contact with subunit a, and the supernumerary subunit A6L are gray, wheat and green forest, respectively. To simplify the representation, the rest of supernumerary subunits e, f, g, j and k have been omitted. Right: View of the entire c-ring and subunit a from the intermembrane space and matrix (upper and bottom panels, respectively) and the path of protons, showing subunit a and c-ring (PDB 6zpo). The side chains of the essential residues for proton transfer, E59 and R159 (c-ring and subunit a, respectively), and the mutated N163 residue are shown as CPK colored sticks with C atoms in grey for c-ring, and in wheat for the subunit a; and (E) alignment of human and murine MT-ATP6 protein sequences. Reported human pathological mutations and the mouse mutation (pink) are highlighted in the sequence with the following color code: green for LOHN causing mutations, blue for NARP, MILS or Leigh syndromes (dark blue: frequent mutations; light blue: rare mutations), purple for autism or schizophrenia-related mutations and yellow for “other mutations”. Triangles indicate mutations creating a stop codon (red: insertion; grey: deletion). Red dots indicate the presence of mutations in the human protein that introduce an amino acid change identical to that of the murine protein.

