Figure 3.
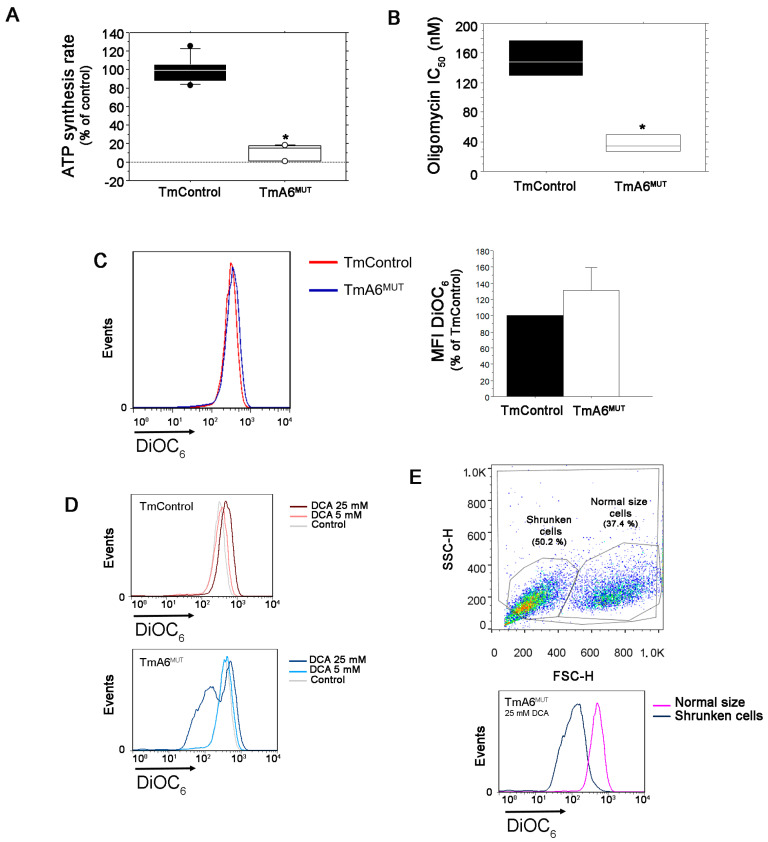
Analysis of mutant cells mitochondrial ATP synthesis activity and membrane potential: (A) ATP synthesis rate measurement in control and mutant cells (n = 9 and 6 for control and mutant cells, respectively; p < 0.0001); (B) IC50 for olygomycin in TmControl and TmA6MUT cells (n = 4 and p = 0.0008); (C) analysis of mitochondrial membrane potential (ΔΨm) in control and mutant cells. Changes in ΔΨm were determined by staining with DiOC6 and analyzed by flow cytometry. As indicated in the legend, red histogram corresponds to TmControl cells, while blue histogram corresponds to mutant cells. The left panel shows a representative histogram of ΔΨm measurement in both cell lines under basal conditions (the further to the right the peak is, the higher the membrane potential) whereas the right panel represents the average ΔΨm of mutant cells relative to controls from two independent experiments; (D) ΔΨm evaluation in both cell lines after treatment with different concentrations of DCA; and (E) Mutant cells were further separated into different populations, depending on their size (normal size and shrunken, left), and their corresponding ΔΨm was compared (right). All values are given as mean ± SD of the mean. Asterisks indicate significant differences respect to control cells, tested by ANOVA post-hoc Fisher PLSD (p < 0.05 or as indicated).

