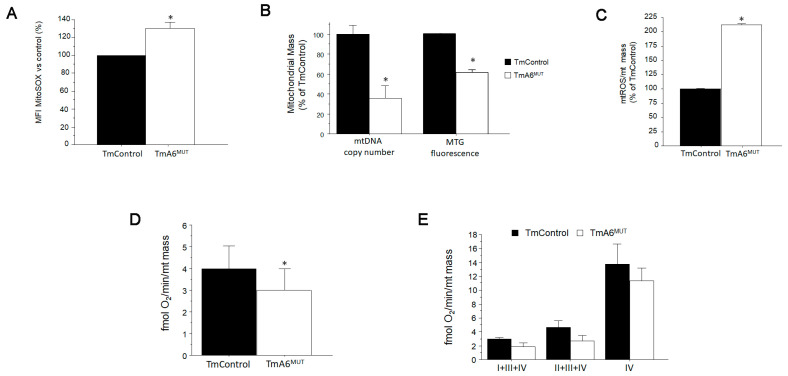
Figure 4.
Analysis of mitochondrial ROS (mtROS) production and mitochondrial mass: (A) mtROS production in control and mutant cells was analyzed by flow cytometry after staining with MitoSOXTM (n = 2 for both cell lines, p = 0.0208); (B) mitochondrial mass was estimated by two different ways: mtDNA copy number quantification by qPCR (left) and flow cytometry (right) after mitochondria staining with MitoTracker GreenTM, a fluorescent probe that specifically stains mitochondria regardless of ΔΨm (n = 5 for mtDNA copy number quantification in both cell lines, p < 0.001 and n = 2 for mitochondrial mass estimation using MitoTracker Green; p = 0.0002); (C) mtROS production per mitochondria. Estimation of mitochondrial superoxide production normalized to mitochondrial mass (n = 3 in both cases, p = 0.025); (D) oxygen consumption (coupled respiration) normalized per mitochondrial mass (n = 9 and 12 for control and mutant respectively, p = 0.046); and (E) oxygen consumption of digitonin-permeabilized cells with specific substrates normalized per mitochondrial mass (n = 2 and 3 for control and mutant respectively and p > 0.05 in all cases). In all cases, the normalization by mitochondrial mass was done using the data from MitoTracker GreenTM staining. All values are expressed as mean ± SD of the mean. Asterisks indicate significant differences respect to control cells, tested by ANOVA post-hoc Fisher PLSD (p < 0.05 or as indicated).

