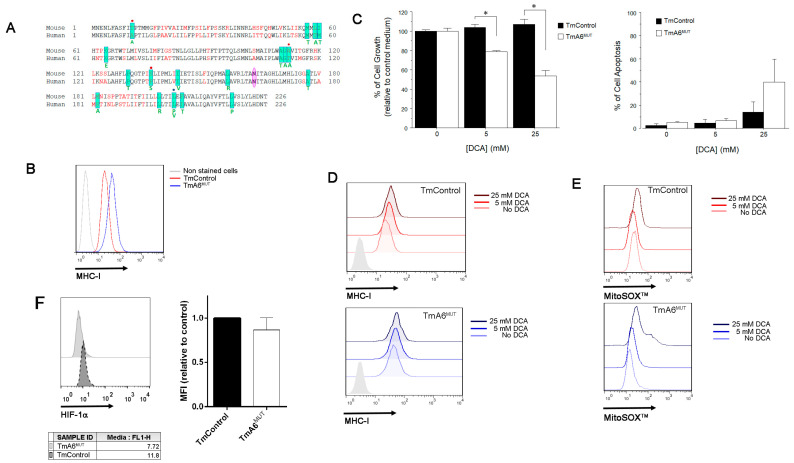
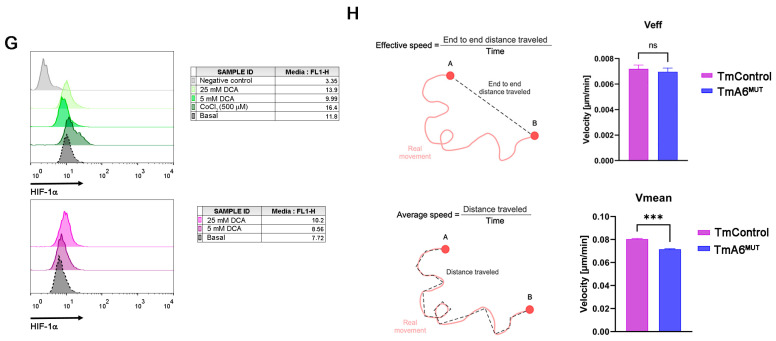
Figure 6.
Tumor phenotype analysis: (A) MT-ATP6 mutations found in human cancers are highlighted in green and the corresponding amino acid change is indicated under the human sequence [33]. Red dots indicate that the mutation promotes a change that is identical to the murine sequence. Blue dot indicates two different changes in the same position; (B) MHC-I expression analysis in untreated TmControl and TmA6MUT cells determined by flow cytometry; (C) Cell growth (left) and cell death (right) after treatment with different DCA concentrations. Cell growth effect was measured using the MTT reduction method (n = 2 for each cell line and treatment; p = 0.0109 and 0.0108 for 5 mM and 25 mM DCA, respectively). To evaluate cell death, cells were simultaneously stained with annexin-V-FITC and 7 AAD and fluorescence was measured by flow cytometry (n= 3 for each cell line and treatment); (D,E) effect of different DCA concentrations on MHC-I expression (D) and on mitochondrial superoxide production (E) in TmControl (upper panels) and TmA6MUT (lower panels) cell lines by flow cytometry; (F,G) analysis of HIF-1α expression levels in basal conditions; (F) and after treatment with different concentrations of DCA; (G) by immunocytochemistry followed by flow cytometry. CoCl2 (500 µM) was included as a control of hypoxia induction effect; and (H) Evaluation of cell migration using microfluidic devices. Definition (left panels) and measurement (right panels) of effective (Veff) and mean (Vmean) speed for TmControl and TmA6MUT cells (n = 3 independent experiments with 3 technical replicas each; p < 0.001). Asterisks indicate statistically significant differences between control and mutant cells: * indicates p < 0.05 and *** indicates p < 0.001.


