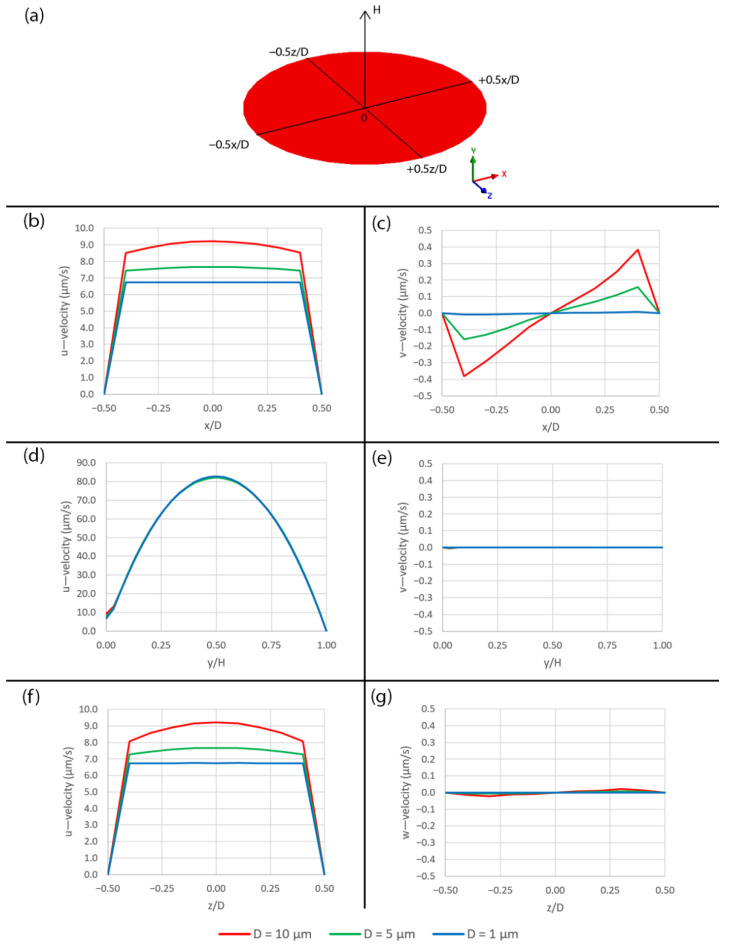
Figure 5.
Diagram of plotting locations and plots of velocity components over the different pore sizes in case of no peristalsis motion. (a) The diagram, (b) plots of u—velocity along x-axis, (c) plots of v—velocity along x-axis, (d) plots of u—velocity along y-axis, (e) plots of v—velocity along y-axis, (f) plots of u—velocity along z-axis and (g) plots of w—velocity along z-axis.

