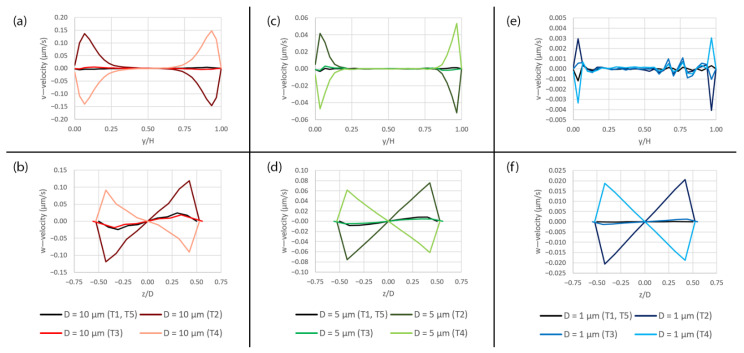
Figure 11.
The plots of the v—velocity along the y-axis and the w—velocity along the z-axis over the pore area subjected to peristalsis motion at five different time points (T1–T5) during a deformation cycle. (a) Plots of the v—velocity along the y-axis over the 10 µm pore, (b) plots of the w—velocity along the z-axis over the 10 µm pore, (c) plots of the v—velocity along the y-axis over the 5 µm pore, (d) plots of the w—velocity along the z-axis over the 5 µm pore, (e) plots of the v—velocity along the y-axis over the 1 µm pore and (f) plots of the w—velocity along the z-axis over the 1 µm pore. The plot locations are shown in Figure 5a.

