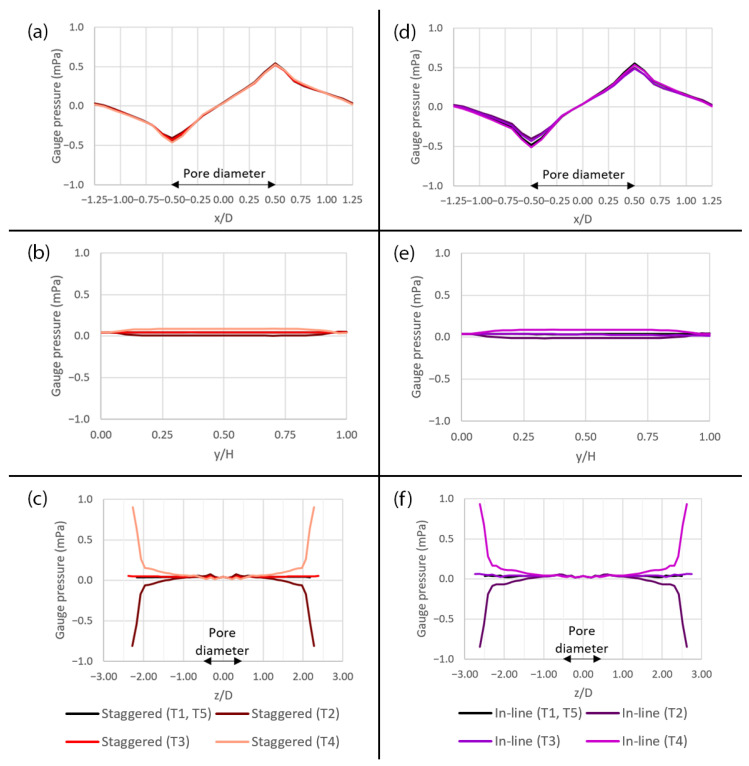
Figure 19.
The plots of gauge pressure across the domain with the pore diameter of 10 µm for two different pattern layouts at five different time points (T1–T5) during a deformation cycle. (a) Along the x-axis in the staggered pattern, (b) along the y-axis in the staggered pattern, (c) along the z-axis in the staggered pattern, (d) along the x-axis in the in-line pattern, (e) along the y-axis in the in-line pattern and (f) along the z-axis in the in-line pattern. The plot locations are shown in Figure 5a.

