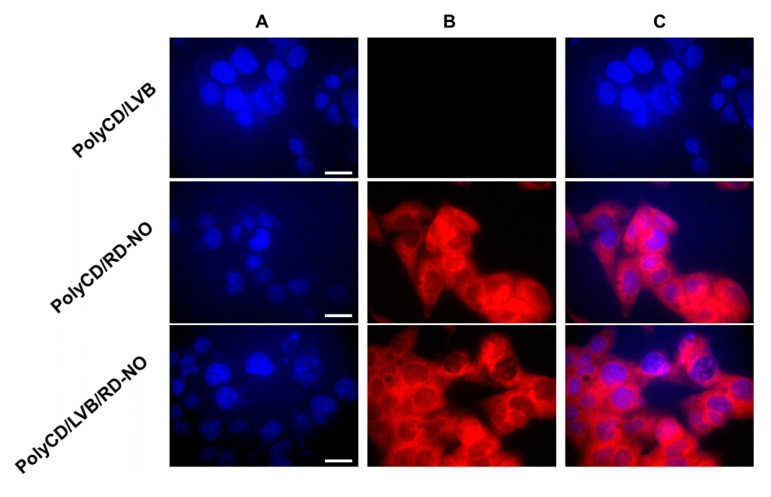
Figure 7.
Fluorescence microscopy analysis of HEP-G2 hepatocarcinoma cell lines treated with PolyCD (2 mg mL−1) in PBS (pH 7.4) loaded with LVB (25 µM), RD-NO (6 µM) and both components and stained with DAPI. The cells were analyzed with a DAPI emission filter (A), a rhodamine emission filter (B), or by merging images (A,B) (C). Scale bar = 50 µM.

