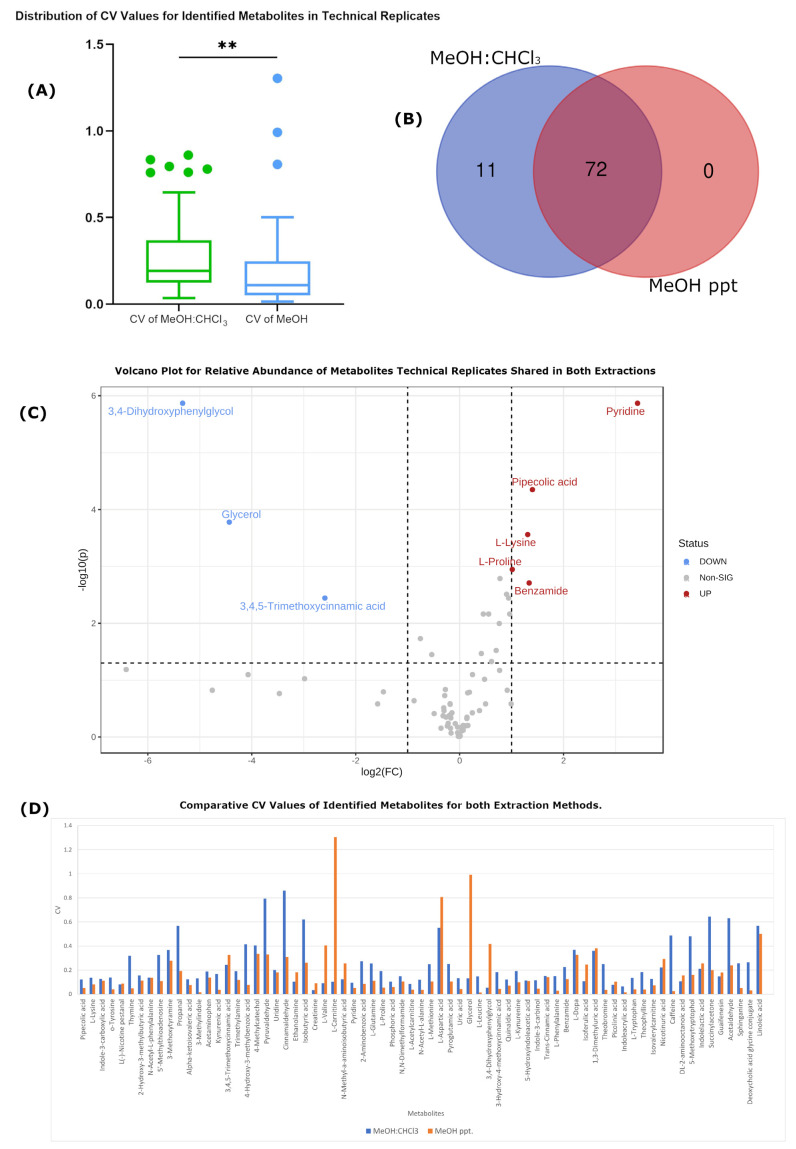
Figure 2.
Representation of technical variation through different statistical analyses. (A) Box plot that shows the distribution of CV values for identified metabolites for both methods. Green color represents CV values of metabolite intensities in MeOH:CHCl3, while blue colour represents CV values of metabolites intensities in MeOH-only. ** indicates p ≤ 0.01 (B) Venn diagram for the total number of metabolites found in each extraction method. (C) Volcano plot that presents the relative abundance of metabolites shared in both extraction methods. Red color the metabolites of methanol-only, while blue color presents the metabolites of MeOH:CHCl3. (D) Column chart that presents the comparison of CV values within each metabolite between the two methods. Blue color represents CV values of metabolite intensities in MeOH:CHCl3, while orange colour represents CV values of metabolite intensities in MeOH-only.

