Figure 4.
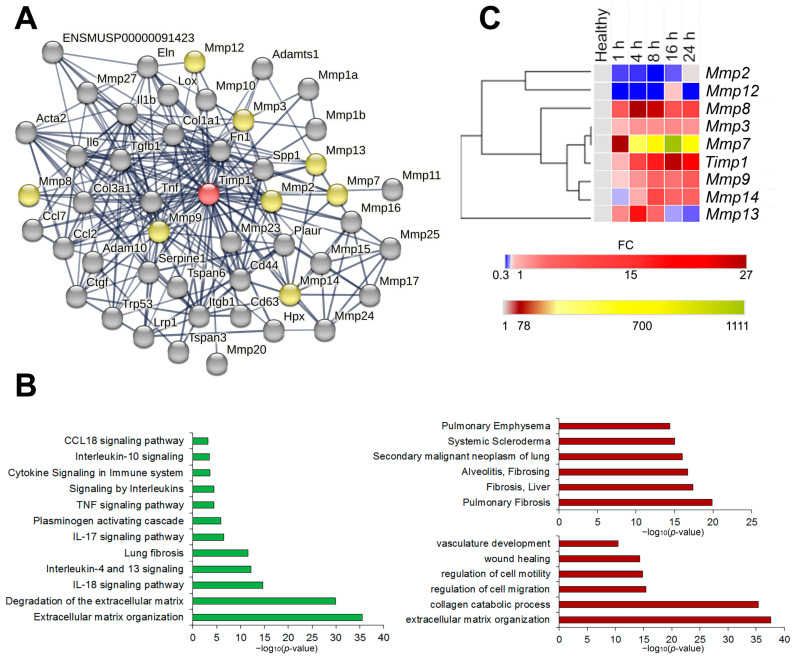
Identification, functional and expression analysis of Timp1 and its first neighbors. (A) Protein–proteins interaction network of Timp1 and its first neighbors reconstructed using the STRING database web-service. No more than 50 highest confidence first neighbors are shown; minimum confidence score of the interators > 0.700. The following interaction sources were used: text mining, experimental data, databases, co-expression, neighborhood, gene fusion and co-occurrence. Red colored node: query gene; yellow colored nodes: first shell interactors from MMP family; gray nodes: all other first shell interactors. (B) Histograms visualizing the functional enrichment analysis of Timp1 and its first neighbors. Functional enrichment analysis was performed through the ToppFun module of the ToppGene suite, using the MSigDB Biocarta (v.7.5.1), BioSystems: Reactome and KEGG, Panther DB (left panel), DisGeNET BeFree and DisGeNET curated (right upper panel) and Gene Ontology: biological processes (right lower panel) databases. For all enrichment tools, the input gene set was composed of the same 44 genes and default options were used: significance threshold of 0.05 for Bonferroni adjusted p-value, at least five genes from the input list in the enriched category, and the whole genome as background. (C) Dynamics of expression levels of Timp1 and interconnected Mmps in the lung tissue of mice with LPS-induced acute lung injury at different time points. Heat map construction was performed using Morpheus. FC = fold change.

