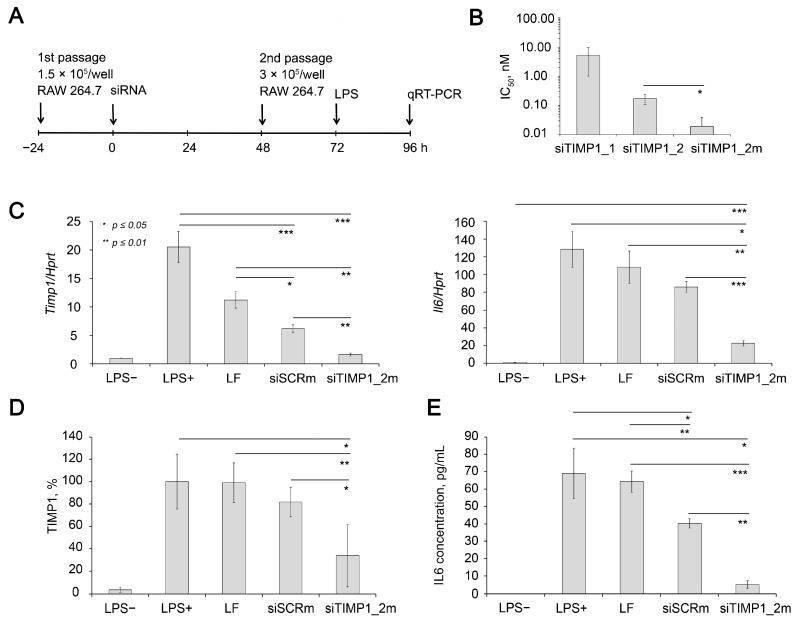
Figure 5.
Silencing activity of anti-Timp1 siRNA in RAW 264.7 cells. (A) Experimental setup. (B) Calculated IC50 of silencing activity of anti-Timp1 siRNAs transfected using Lipofectamine 2000 in RAW 264.7 cells. The efficiency of Timp1 silencing was compared to the untreated cells. Four independent samples were measured in triplicates for each point. (C) Relative mRNA levels of Timp1 and Il6 in RAW 264.7 cells after LPS stimulation, transfection was carried out with Lipofectamine 2000. The level in control, non-treated cells was set as 1. The data represent the mean ± standard deviation from six or seven independent experiments analyzed in triplicates. (D) Relative TIMP1 protein level in RAW 264.7 cells 16 h after LPS stimulation, transfection was carried out with Lipofectamine 2000 4 days before measurement. The data represent the mean ± SD from three experiments. Representative Western blot image is presented at Supplementary Figure S3. Three independent samples were analyzed for each point. (E) Relative IL6 protein level in the culture medium of RAW 264.7 cells 16 h after LPS stimulation; transfection was carried out with Lipofectamine 2000 4 days before LPS stimulation. The data represent the mean ± SD from three experiments. Three independent samples were measured in duplicates for each point. * p ≤ 0.05, ** p ≤ 0.01, *** p ≤ 0.001, Student’s two-tailed unpaired t-test.

