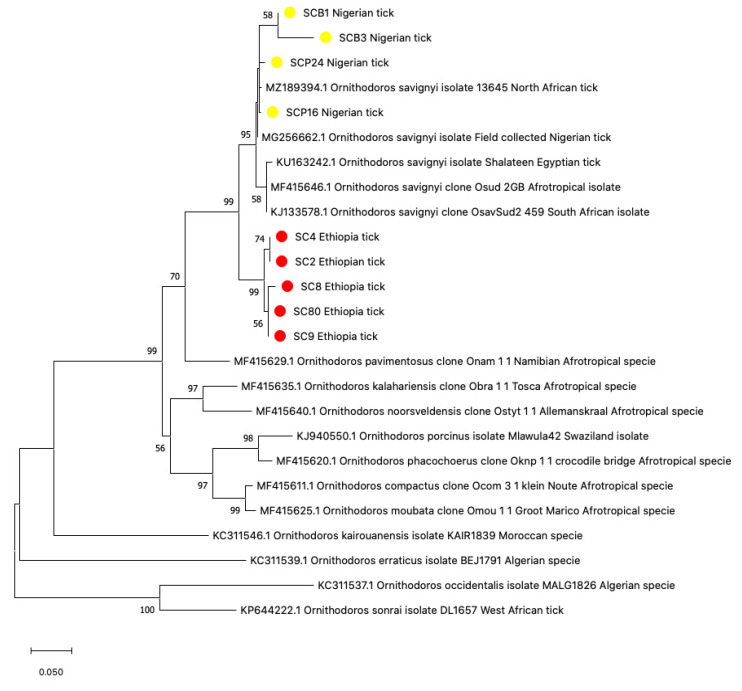
Figure 4.
Phylogenetic analysis of Neighbor-joining tree of tick 16S rRNA sequences (450 bp), comparing the Nigerian and Ethiopian ticks with other Ornithodoros species. The tree with the highest log likelihood (−3939.77) is shown. Evolutionary distances were calculated using the maximum likelihood method in MEGA 11. Bootstrap values were >50% based on a test of confidence of 1000 replicates shown on branch nodes. The yellow and red circles represent the Nigerian and Ethiopian tick sequences respectively generated from this study.

