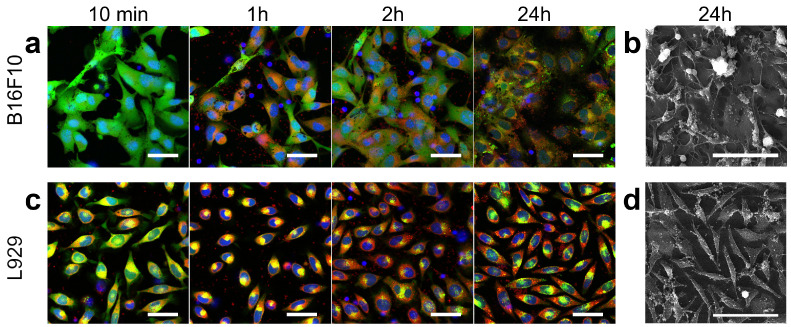
Figure 4.
Microscopy of adherent cell cultures incubated with platelets for 24 h. Fluorescence microscopy of B16F10 (a) and L-929 (c) during incubation with platelets. Blue, green, and red colors correspond to Hoechst (nucleus), Calcein AM (cytoplasm), and Nile Red (preliminary staining of isolated platelet membrane) staining, respectively. All cells were stained before adding platelets and no restaining was performed 24 h later. Scale bars are 20 m. Scanning electron microscopy of (b) B16F10 and (d) L-929 after 24 h of incubation with platelets. Scale bars are 100 m.

