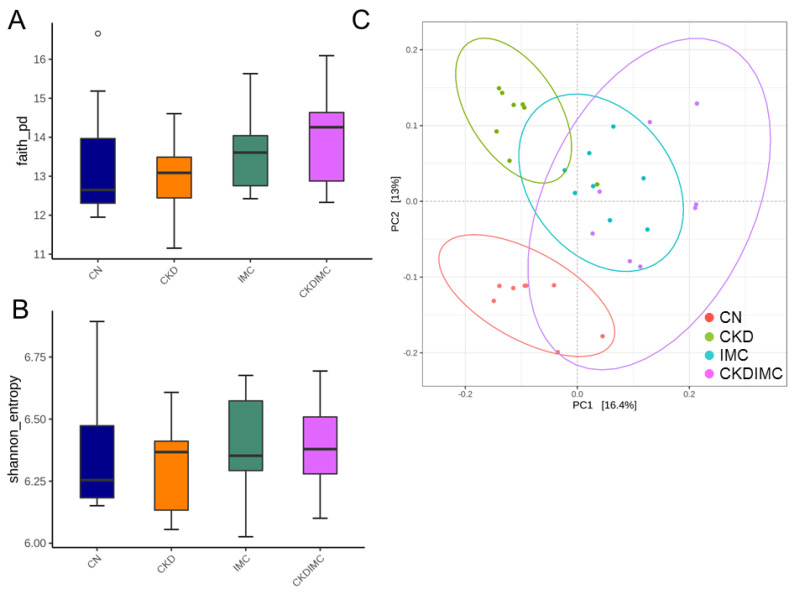
Figure 4.
Bacterial α-diversity for gut microbial communities among four groups in (A) Faith’s phylogenetic diversity (PD) index and (B) Shannon index. The outlier is shown as a dot. (C) Bacterial β-diversity analysis using principal coordinate analysis (PCoA). Each dot represents the microbiota of a single sample, and the color of the dot reflects metadata for that sample.

