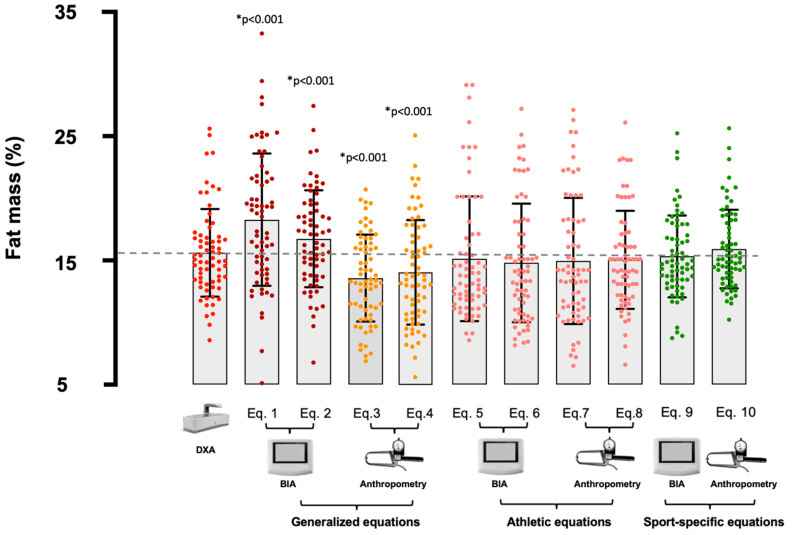
Figure 1.
Mean and individual values for the percentage of fat mass (FM%) obtained from Dual X-ray Absorptiometry (DXA) and the selected equations; the upper and lower limits represent the standard deviation of the data. BIA = bioelectrical impedance analysis; Eq. 1 = Lukaski and Bolonchuk [21]; Eq. 2 = Sun et al. [22]; Eq. 3 = Durnin and Womersley [23]; Eq. 4 = Lean et al. [24]; Eq. 5 = Matias et al. [25]; Eq. 6 = Stewart et al. [26]; Eq. 7 = Evans et al. [27]; Eq. 8 = Witers et al. [28]; Eq. 9 = Matias et al. [29]; Eq. 10 = Giro et al. [30]. The dotted line identifies the mean value obtained with DXA; * = significant difference from DXA.

