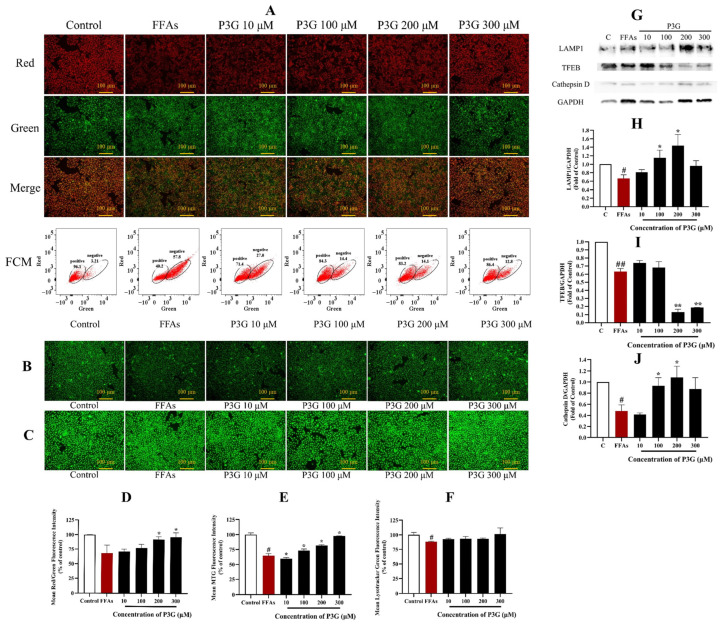
Figure 5.
P3G’s effect on mitochondrial membrane potential, mitochondrial mass, lysosome level, and the expression of lysosome-related proteins in L02 cells. (A) JC-1 fluorescent image (×200) and FCM results of JC-1 staining (positive, cells with red fluorescence; negative, cells with green fluorescence); (B) MitoTracker Green fluorescent image (×200); (C) LysoTracker Green fluorescence image (×200); (D) quantitative data of panel (A); (E) quantitative data of panel (B); (F) quantitative data of panel (C); (the control group was considered as 100%; # p < 0.05, ## p < 0.01 compared with control; * p < 0.05, ** p < 0.01 vs. FFA-treated group). (G) Western blots of cellular cathepsin D, TFEB, and LAMP1 proteins; (H) quantitative data of LAMP1; (I) quantitative data of TFEB; (J) quantitative data of cathepsin D. The Western blots test was repeated 3 times and the image presented was typical of these 3 independent tests. (The control group was considered as 1.0; # p < 0.05, ## p < 0.01 compared with control; * p < 0.05, ** p < 0.01 vs. FFA-treated group).

