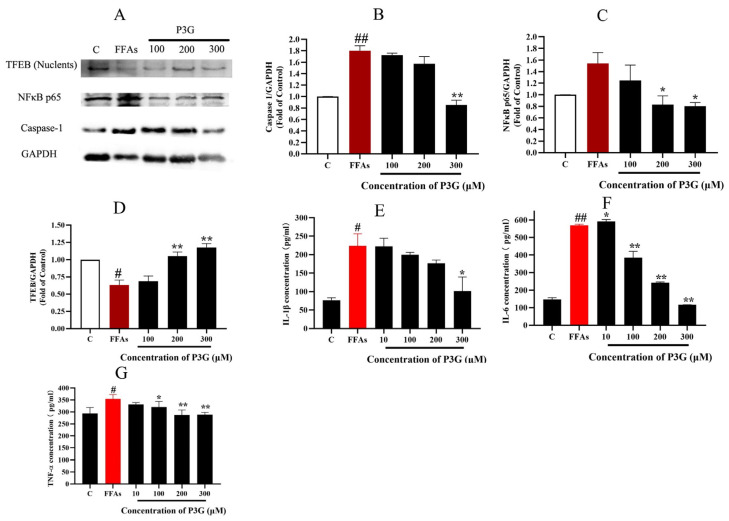
Figure 6.
Effect of P3G on the expression of inflammation-related proteins in L02 cells. Following 0.5 mM FFA treatment, L02 cells were incubated with P3G at various doses (100, 200, and 300 μM) for 24 h. (A) Western blots of cellular caspase-1, NF-κB p65, and TFEB (Nuclents) proteins; (B) quantitative data of caspase-1; (C) quantitative data of NF-κB p65; (D) quantitative data of TFEB (Nuclents); (the Western blots test was repeated 3 times and the image presented was typical of these 3 independent tests. The control group was considered 1.0; # p < 0.05, ## p < 0.01 compared with control; * p < 0.05, ** p < 0.01 vs. FFA-treated group). The amount of IL-1β (E), IL-6 (F), and TNF-α (G) were determined according to the ELISA product instructions; (E) quantitative data of IL-1β; (F) quantitative data of IL-6; (G) quantitative data of TNF-α. (Control group was considered as 1.0; # p < 0.05, ## p < 0.01 compared with control; * p < 0.05, ** p < 0.01 vs. FFA-treated group.).

