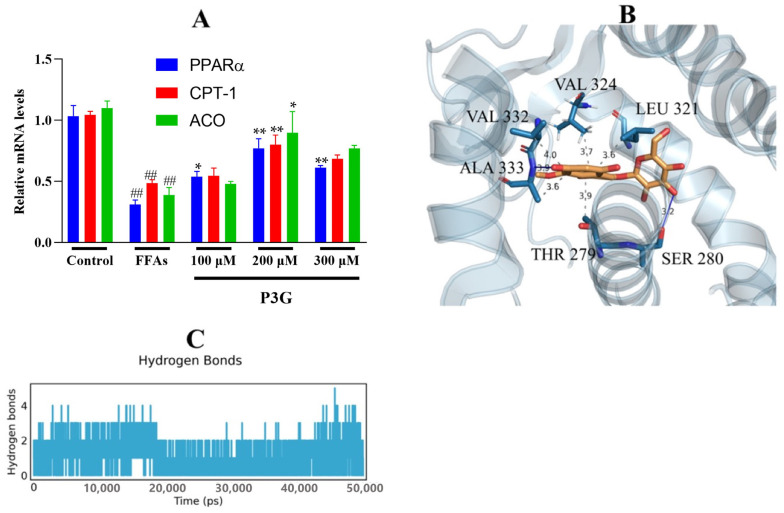
Figure 7.
P3G’s effects on the expression level of PPAR and associated enzymes, as well as the result of their molecular docking. Following 0.5 mM FFA treatment, L02 cells were incubated with P3G at various doses (100, 200, and 300 μM) for 24 h. (A) The mRNA level of PPARα, CPT1A, and ACOX1 (Control group was considered as 1.0; ## p < 0.01 compared with control; * p < 0.05, ** p < 0.01 vs. FFA-treated group.); (B) the predicted binding complex of P3G and PPAR, P3G is colored in yellow, hydrogen bonds are colored in blue, and π−σ hydrophobic interactions are colored in gray; (C) with increasing simulation time, the amount of hydrogen bonds between P3G and PPAR dynamically changes.

