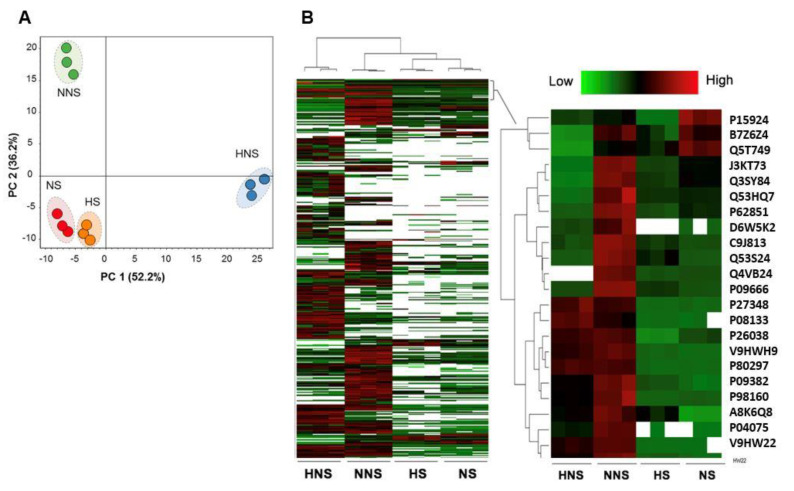
Figure 2.
Proteomic analysis demonstrated qualitative and quantitative differences in HBMSC-EV protein content when the HBMSC were not exposed to starvation pre-conditioning. (A) Principal component analysis (PCA) of normalized total protein abundance (peak area) of the HBMSC-EV subtypes showed that the protein signatures of the NS (normoxia starvation) and HS (hypoxia starvation) subtypes were similar, while the rich media HBMSC-EV subtypes exposed to normoxia (NNS) and hypoxia (HNS) were significantly different from each other. (B) Heat map clustering of the total proteins identified and quantified proteins shows differential abundance among the four HMBSC-EV subtypes that had a distinct enrichment pattern.

