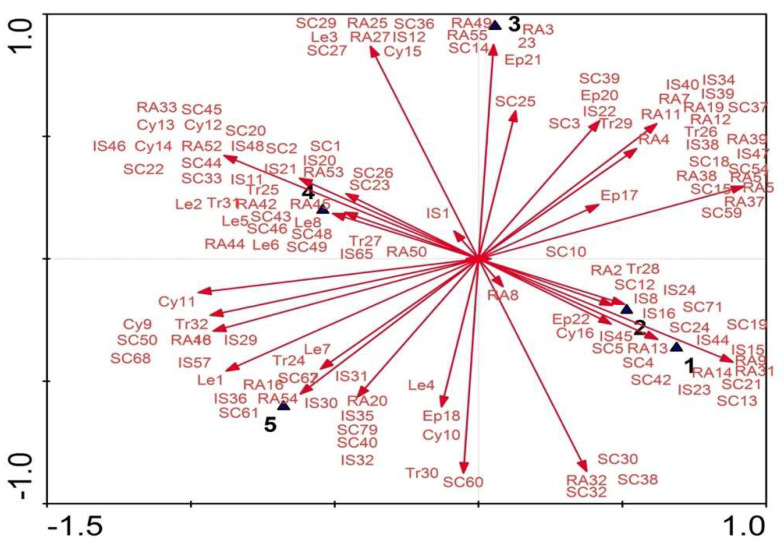
Figure 11.
DCCA Triplot of the distribution of the studied taxa and their relationships to morphological and molecular characters. Taxa: 1− C. intybus var. intybus, 2− C. intybus var. foliosum, 3− C. endivia var. endivia, 4− C. endivia var. crispum, 5− C. endivia subsp. pumilum. Characters: Le− leaf, Cy− Cypsela, Ep− epidermal, Tr−trichome, SC− SCoT, RA− RAPD, and IS− ISSR.

