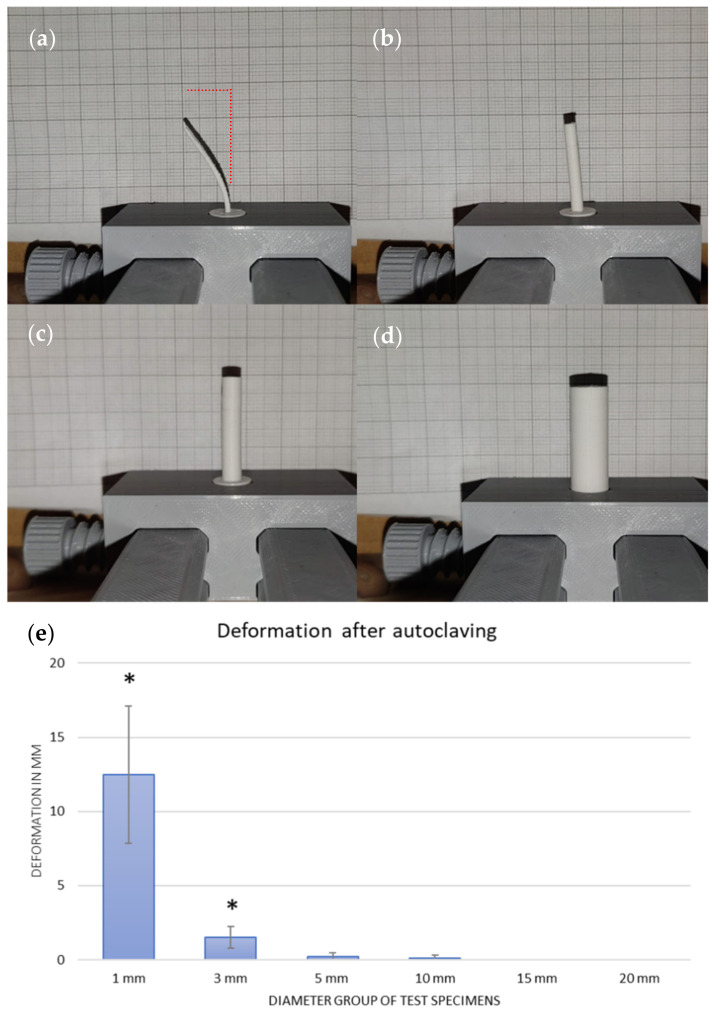
Figure 4.
The reduction of the deviation with ascending diameter of the specimen can be seen. The specimens are rotated to their maximum degree of deviation, starting with 1 mm (a), 3 mm (b), 5 mm (c), and 10 mm (d). (e) A diagram which shows the resulting biggest deformation of one axis of the test specimen in mm and the related SD. After autoclaving, the groups with diameters ranging from 1 to 3 mm showed significant deformation (shown by “*”).

