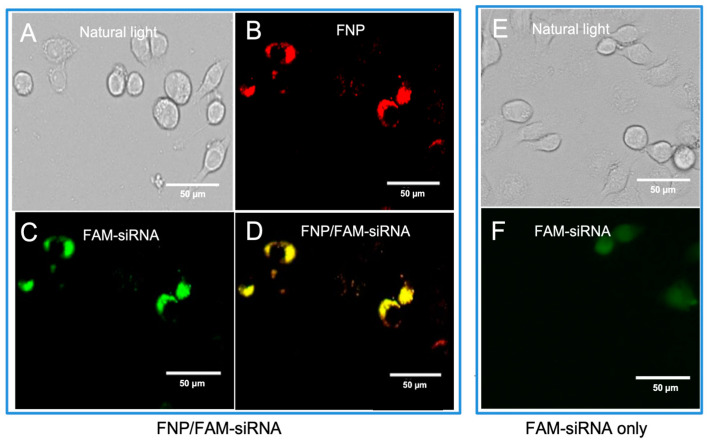
Figure 1.
Fluorescence images of FNP–siRNA complexes in cells at 24 h after incubation (0.05 μM FNP, 100 μM DNA, N/P = 2:1, red: FNP, green: FAM fluorescence). For FNP/FAM-siRNA delivery group: (A) Bright-field channel. (B) Red fluorescence channel showing FNP. (C) Green fluorescence channel showing FAM-siRNA. (D) Fluorescence images of FNP-siRNA complexes ((B,C) merged). For the control group, FAM-siRNA only: (E) Bright-field channel. (F) Green fluorescence channel showing FAM-siRNA.

