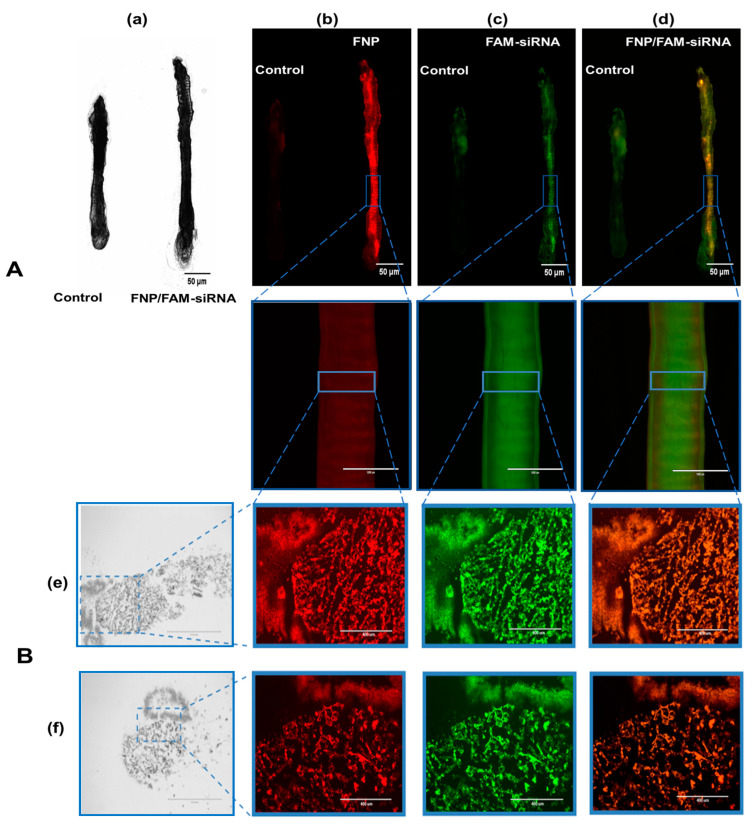
Figure 4.
(A): Fluorescence images of dissected larval gut visualizing the distribution of FNP and siRNA. The 3rd instar larvae of H. armigera were fed an artificial diet of 5 µL of the FNP-FAM-siRNA complex containing 2.5 μg FAM-siRNA (red: FNP, green: FAM reference dye). A diet containing 5 μL DEPC-treated ddH2O was fed to H. armigera as the negative control. (a) Bright-field channel scanning. (b) Red fluorescence channel. (c) Green fluorescence channel. (d) Fluorescence of FNP–FAM-siRNA complexes. Scale bars (in left black-and-white micrographs and right upper three fluorescence micrographs) indicate 50 μm. Scale bars (in lower three of fluorescence micrographs) indicate 1000 μm. (B): Fluorescence images of FNP and siRNA in larval gut frozen sections. The mixture of FAM-siRNA and FNP was added to food to feed H. armigera larvae. After 24 h, the midgut was dissected and sectioned for observation. (e) Fluorescence images of the rip section. (f) Fluorescence images of the cross-section. FNP (red) and FAM-siRNA (green) were detected by fluorescence microscopy. Scale bars (in left black-and-white micrographs) indicate 1000 μm. Scale bars (in fluorescence micrographs) indicate 400 nm.

