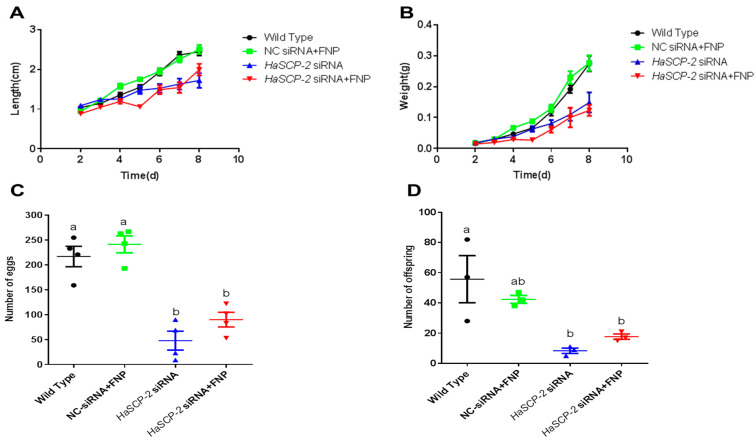
Figure 9.
Life cycle analyses. (A) Analysis of average larval body length from day 2 to 8 post RNAi. (B) Analysis of average larval body weight from day 2 to 8 post RNAi. (C) Number of eggs. (D) Number of offspring. Data are mean ± SD. Different letters above bars indicate that the mean values differ from each treatment significantly (p < 0.05, Tukey’s HSD multiple test) between the different treatments.

