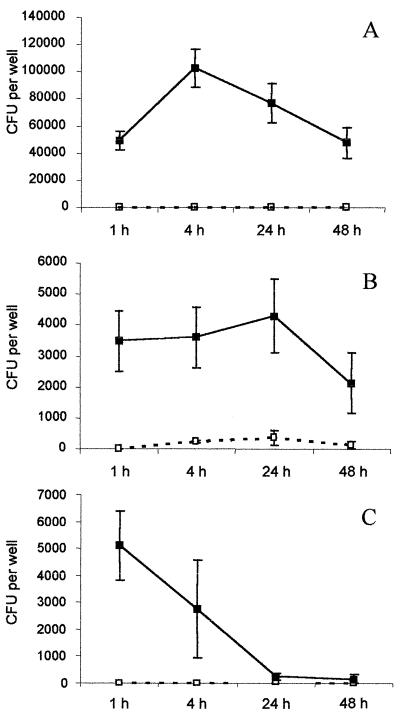
FIG. 3.
Survival of AIEC LF82 (A) compared to those of serovar Dublin SL2260 (B) and nonpathogenic E. coli K-12 C600 (C) in HMDM. Each time point represents the mean of three independent experiments in triplicate wells. Bacterial CFU per well containing 5 × 10⁵ macrophages (y axis) and the time after addition of gentamicin (x axis) are shown. Numbers of viable bacteria were determined in the attached (■) and detached (□) macrophage fractions.

