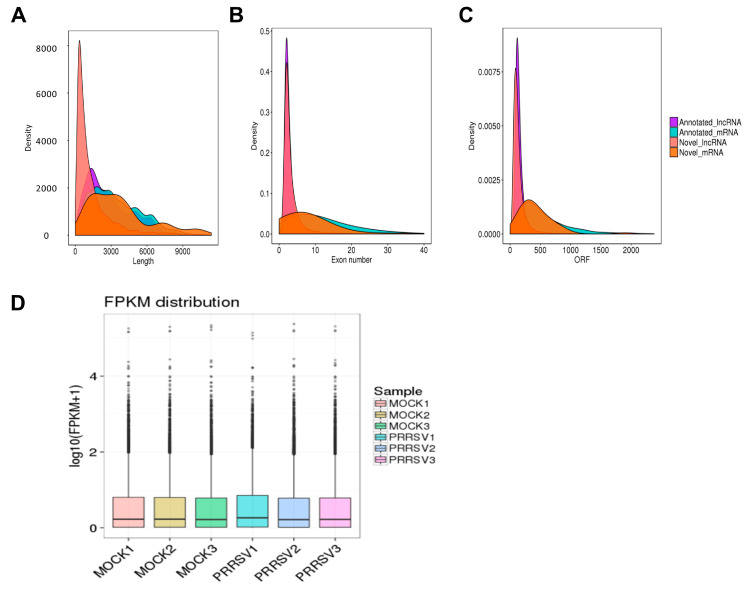
Figure 2.
The RNA sequencing and lncRNA identification. (A) lncRNA and mRNA length comparison density distribution map. (B) Exon number density distributions of lncRNA and mRNA. (C) ORF length density distributions of lncRNA and mRNA. (D) Boxplots demonstrating the expression levels of lncRNAs and mRNAs in each sample.

