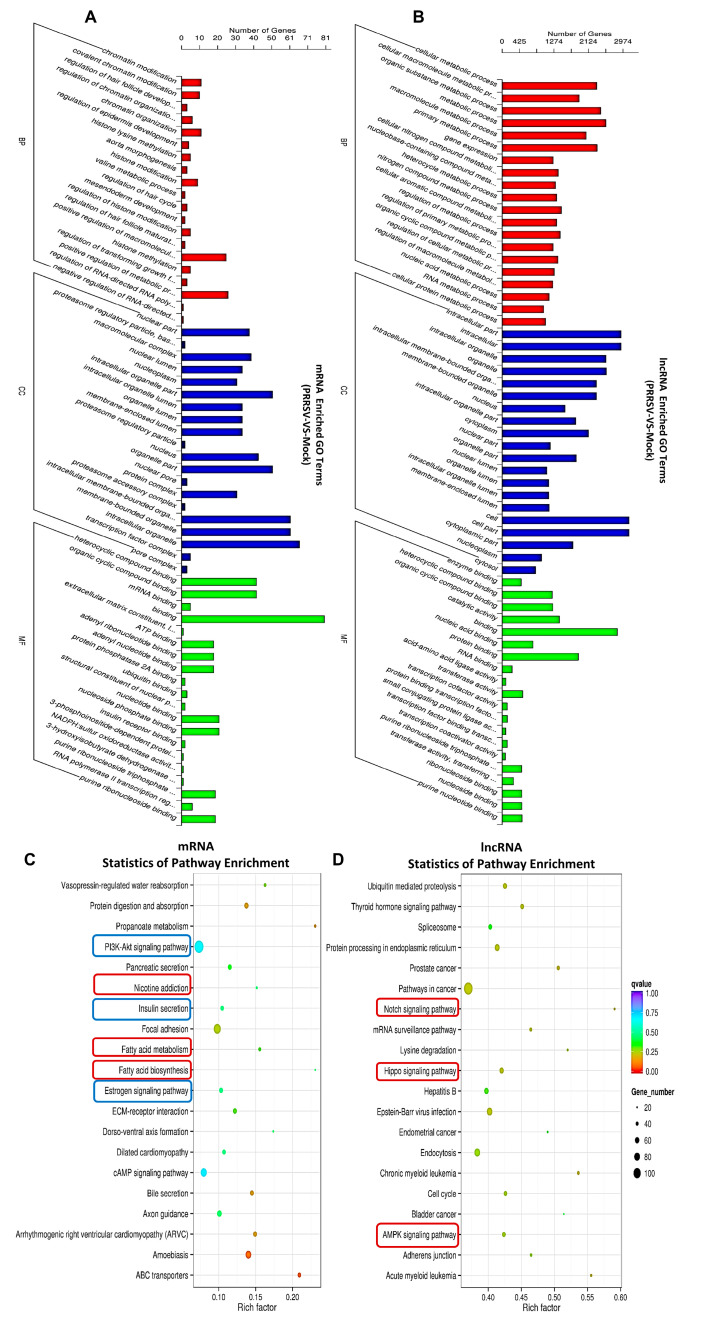
Figure 4.
Pathway analysis for the dysregulated mRNAs and lncRNAs in the PTR2 cells infected with PRRSV. Significant enrichment of the GO terms of mRNAs (A) and lncRNAs (B). Analysis of the top 20 over-represented KEGG pathways of mRNAs (C) and lncRNAs (D). The enrichment factor was calculated as the number of enriched genes divided by that of all the background genes in each pathway. (B,D) show the enriched pathways of lncRNAs with effects in the trans-regulated genes.

