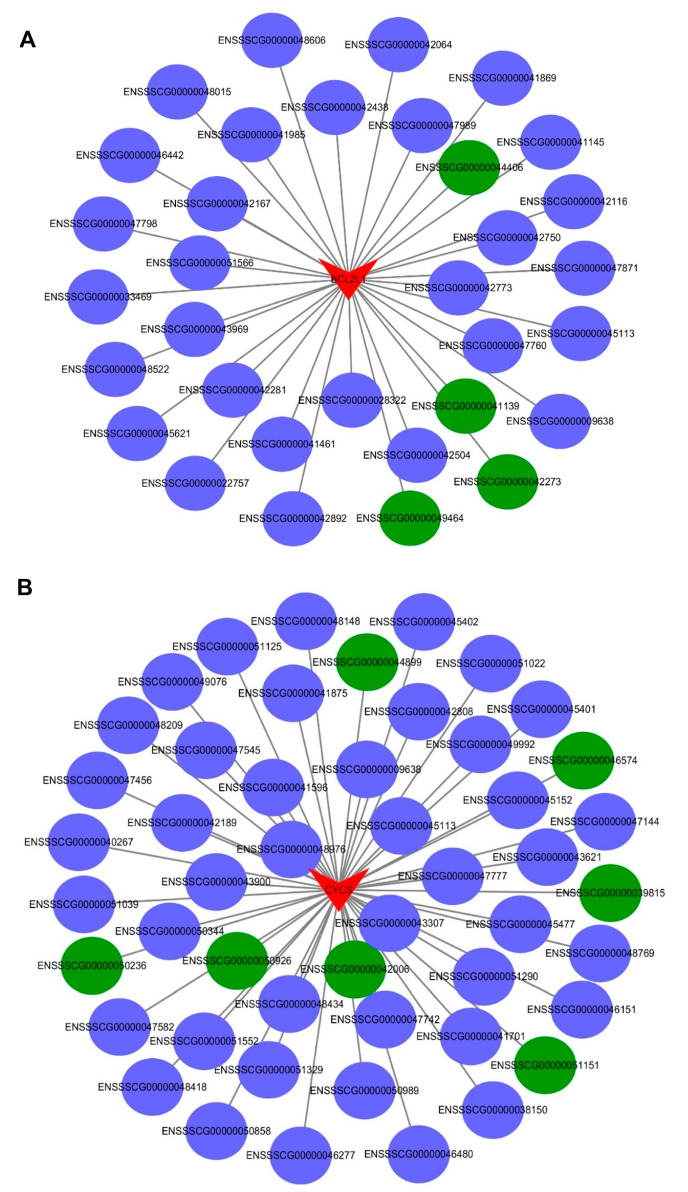
Figure 9.
The interaction between the differentially expressed mRNAs and lncRNAs associated with apoptosis in the PTR2 cells infected with PRRSV. BCL2L1 (A) and CYCS (B) network analysis provide a global view of all possible lncRNA-mRNA expressions. The arrows represent mRNAs and the ellipses represent lncRNAs. Blue means up-regulation, green means down-regulation.

