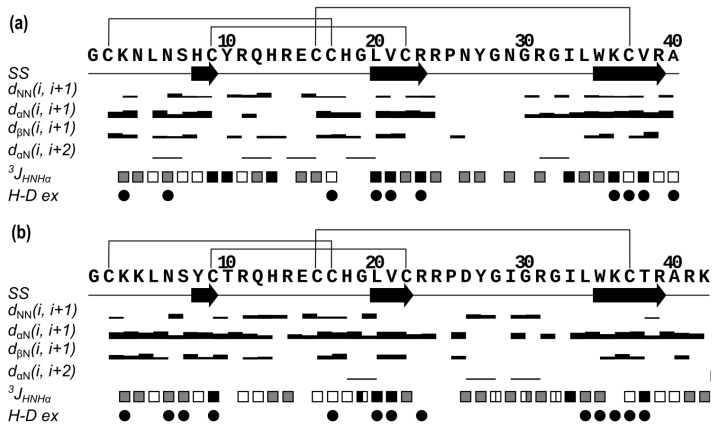
Figure 6.
Overview of the NMR data that define the secondary structure of Ms11a-2 (a) and Ms11a-3 (b). Protein sequence, secondary structure (SS), NOE connectivities (dij), 3JHNHα couplings and hydrogen-deuterium exchange rate (H-D ex) are shown. The arrows indicate strands of the β-strands. Widths of the bars represent the relative intensity of cross-peaks in NOESY spectra. Squares have three colors according to the value of J-coupling: black (large, >8 Hz), grey (medium, 6–8 Hz) and white (small, <6 Hz); for glycines, squares are divided into two rectangles, which correspond to 3JHNHα2 and 3JHNHα3 constants. Circles denote the HN protons, with the solvent exchange rates slower than 4 h−1. Disulfide bonds are shown as black lines.

