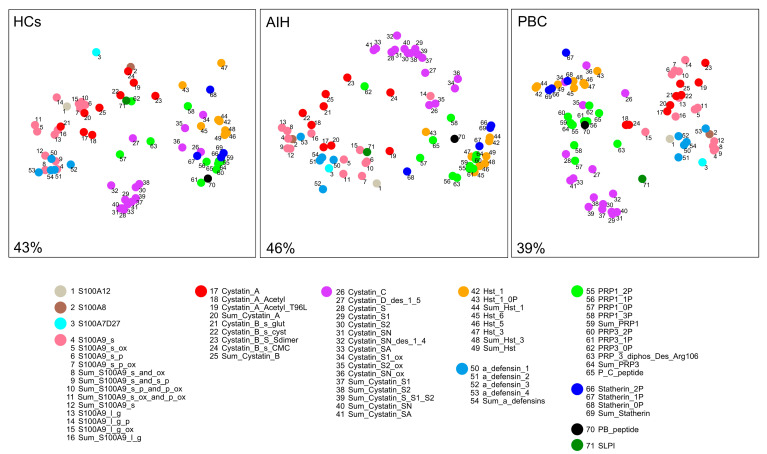
Figure 2.
Multidimensional scaling (MDS) diagrams of Kendall correlations among protein levels in the HCs, AIHp and PBCp groups. To facilitate the understanding of the diagrams, the 71 components were grouped into different categories, numerically and color encoded, based on their structural/functional similitudes and secretory origin. The degree of clustering of points accounts for the degree of proteins/peptides co-expression. Percent values indicate how much two-dimensional diagrams represent the information contained in the whole multi-dimensional structure.

