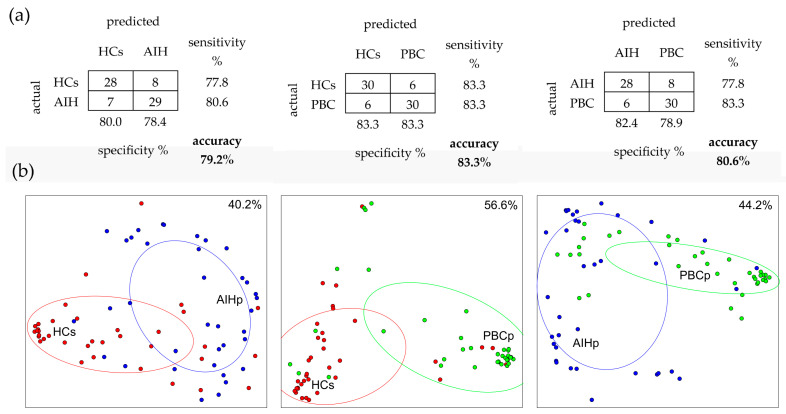
Figure 3.
RF applied to three mixed data sets. (a) Confusion matrices of RF classifications validated by out-of-bag samples. Matrix rows represent the actual classes, while columns represent the predicted classes. Marginal rows show the frequency of false positives, while marginal columns show the frequency of false negatives. The overall accuracy considers both true positives and true negatives. (b) Multidimensional Scaling (MDS) diagrams showing the relationship among subjects, using the proximity values calculated by RF. Each group is delimited by a dispersion ellipse with a confidence of 1.6 standard deviations. Percent values indicate how much two-dimensional diagrams represent the information contained in the whole multi-dimensional structure.

