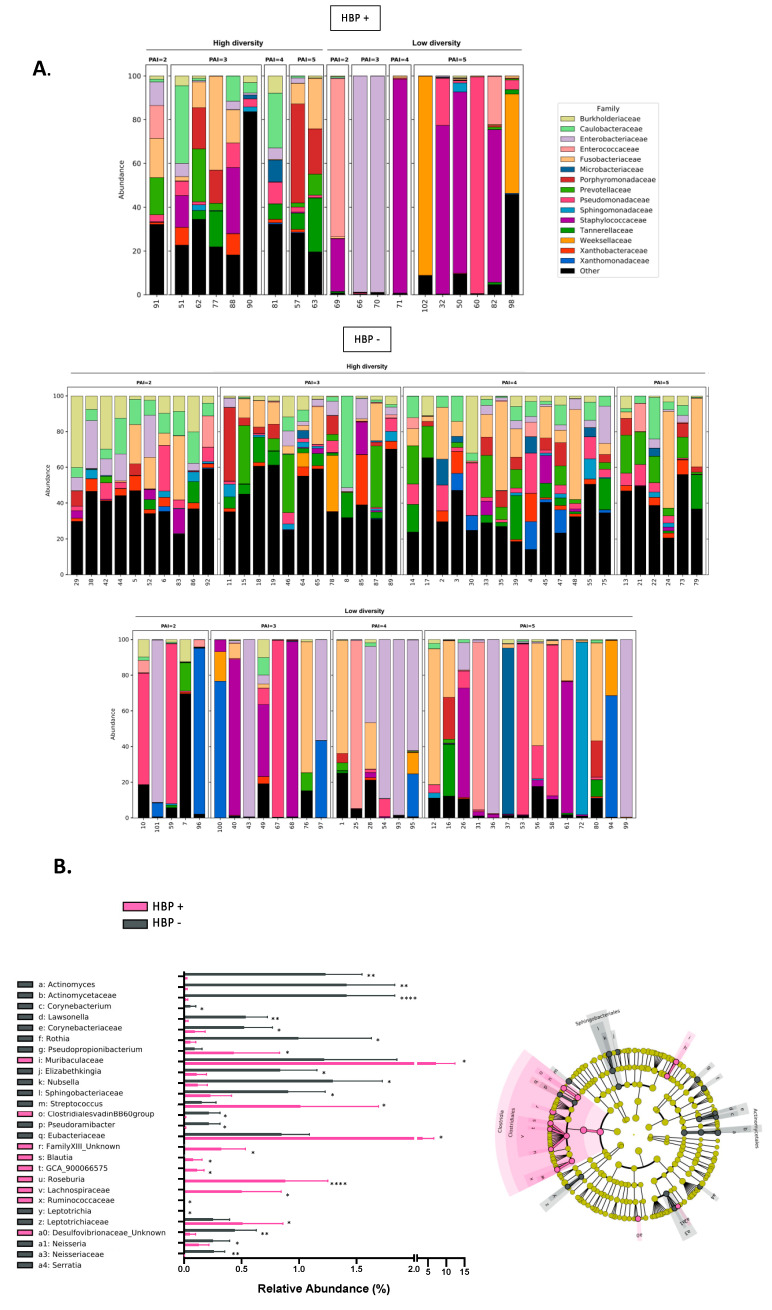
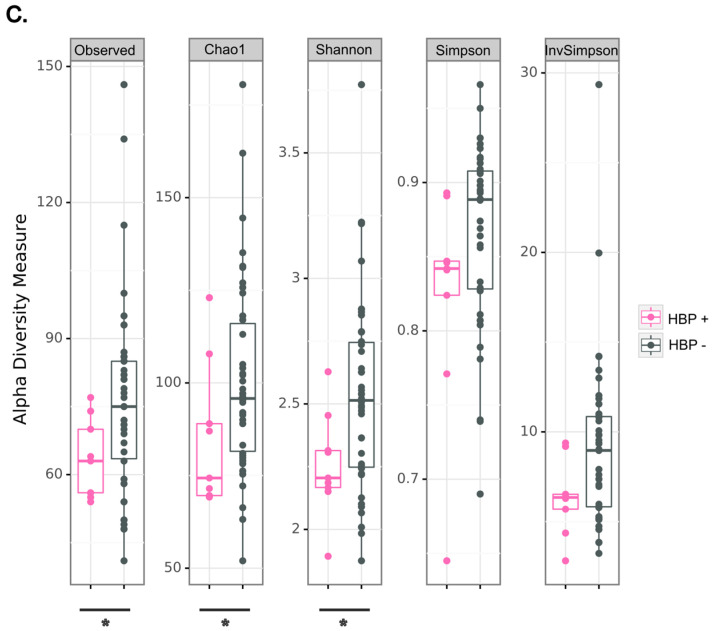
Figure 4.
Microbiota profiles of high-diversity samples from granuloma split into the two groups: subjects with high blood pressure (HBP+) and without high blood pressure (HBP−). (A) Granuloma microbiota composition at family level for high diversity split into the two groups, HBP+ and HBP−. Only the top 15 most abundant families are displayed; the remaining families are aggregated in the “other” category. (B) Linear discriminant analysis (LDA) effect size (LEfSe) cladogram of pairwise analysis for 16S rDNA sequence analysis of granuloma samples (the cladogram shows the taxonomic levels represented by rings with phyla at the innermost ring and genera at the outermost ring, and each circle is a member within that level) between the two groups, HBP+ and HBP− The histogram for relative abundance (%) for taxonomic groups identified by single letters in cladogram. (Data as mean ± SEM; * p < 0.05, ** p < 0.01, **** p < 0.0001, unpaired Mann–Whitney test and LDA score 2.0 for cladograms). (C) Alpha diversity analyses at OTU level confirm HBP+ and HBP− microbiome profiles in granuloma. Boxplots show the distribution of bacterial richness (observed OTUs and diversity (Shannon and Simpson) values of granuloma microbiota HBP+ and HBP− diversity profiles. Statistically significant differences were determined using a Wilcoxon test (* p < 0.05).


