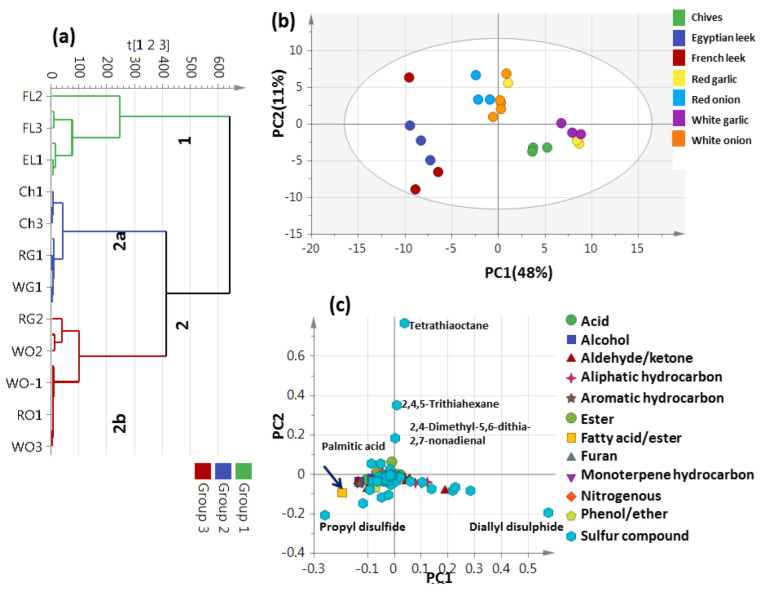
Figure 4.
Unsupervised multivariate data analyses of the studied Allium species derived from modeling volatile metabolites dataset analyzed using SPME GC-MS (n = 3). (a) HCA plot. (b) PCA score plot of PC1 vs. PC2. (c) Loading plot for PC1 and PC2, providing variant peaks and their assignments. The metabolome clusters are placed in two-dimensional space at the distinct locations defined by PC1 = 48% and PC2 = 11%.

