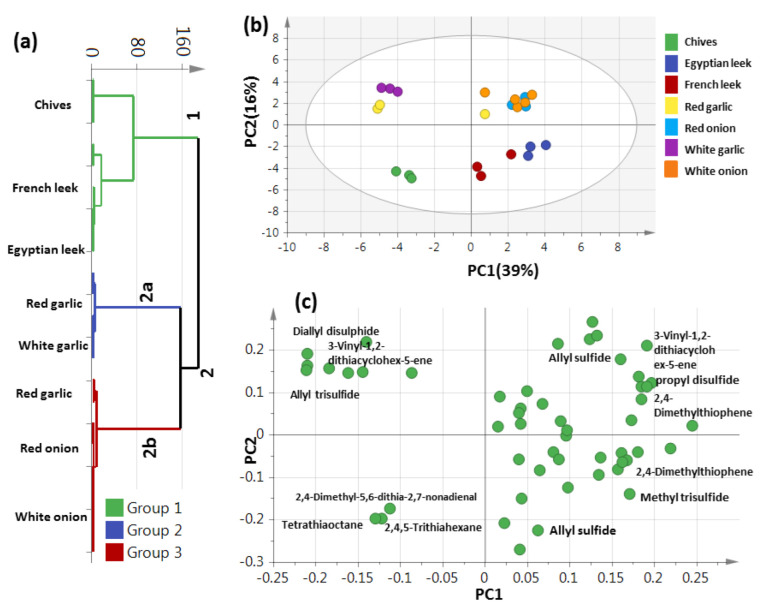
Figure 5.
Unsupervised multivariate data analyses of the studied Allium species derived from the modeling of sulfur metabolites analyzed via GC-MS (n = 3). (a) HCA plot. (b) PCA score plot of PC1 vs. PC2 scores. (c) The respective loading plot for PC1 and PC2, providing mass peaks and their assignments. The metabolome clusters are placed in two-dimensional space at the distinct locations defined by two vectors of principal component PC1 = 39% and PC2 = 16%.

