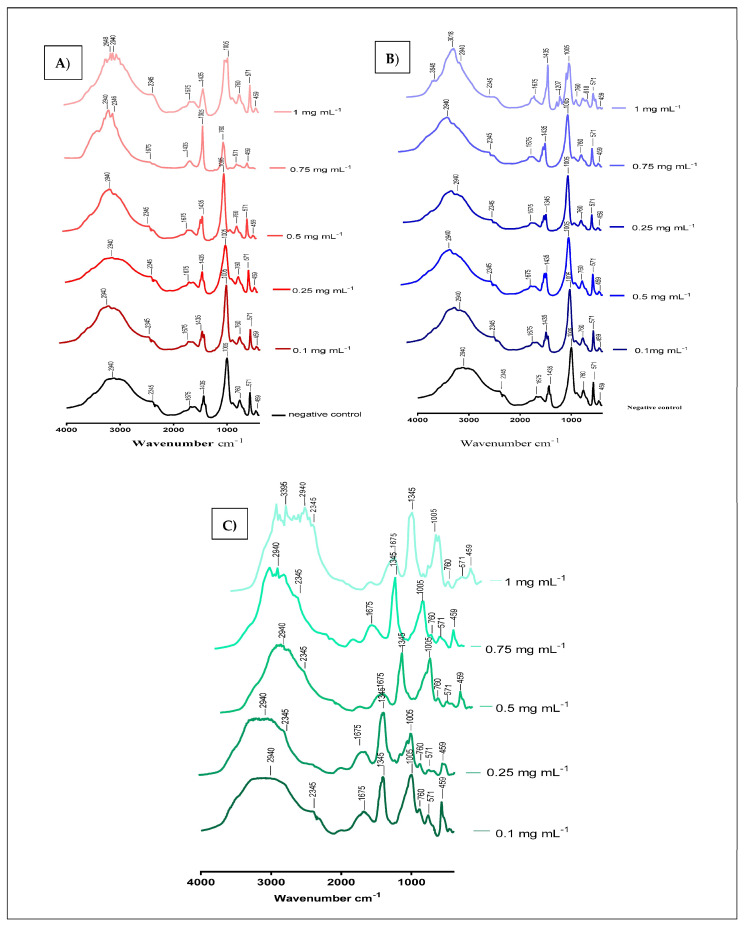
Figure 6.
(A) FT-IR spectra of struvite before and after exposure to various concentrations of S. costus ethanolic extracts. (B) FT-IR spectra of struvite before and after exposure to various concentrations of S. costus aqueous extracts of. (C) FT-IR spectra of struvite before and after exposure to cystone at various concentrations.

