Figure 4.
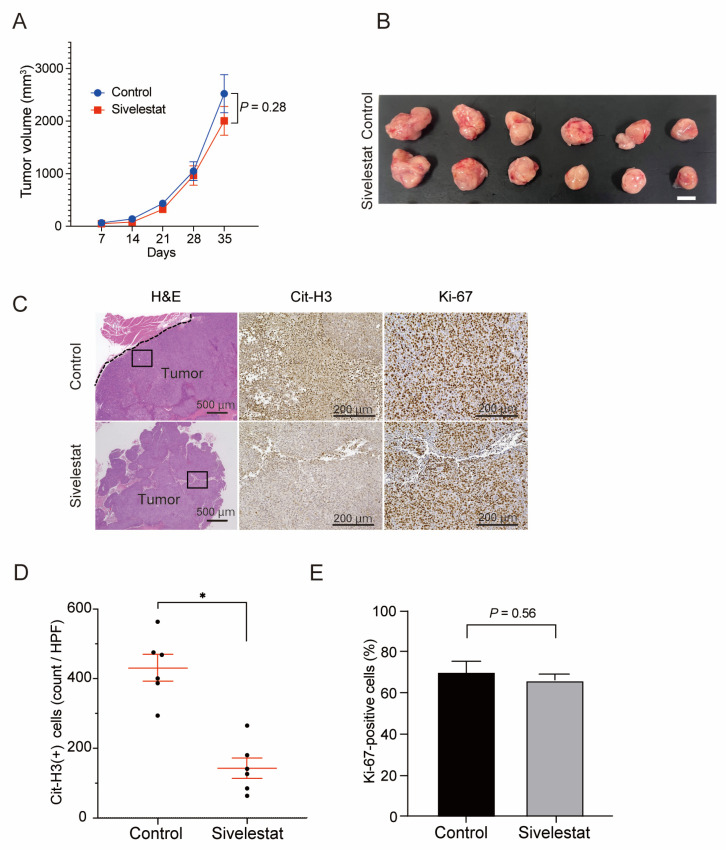
The suppression of NET formation by NE inhibitors had no effect on the growth of subcutaneous implanted tumors of CRC cells in vivo. (A) Growth curves of the subcutaneous transplanted tumors of HCT116 in the KSN/slc nude mice treated with sivelestat (10 mg/kg) or vehicle control. Mean: bars ± SEM. n = 6 tumors in each group. p values calculated with Student’s t-test. (B) Representative macroscopic images of the subcutaneous transplanted tumors of HCT116 cells dissected from KSN/slc nude mice treated with sivelestat (10 mg/kg) or vehicle control on day 35. Scale bars, 10 mm. (C) IHC staining for H&E, Cit-H3 and Ki-67 in subcutaneous transplanted tumors. Representative images are shown (H&E: scale bars, 500 μm. Cit-H3, Ki-67: scale bars, 200 μm). (D,E). Quantification of Cit-H3-positive cells (D) and percentage of Ki-67-positive cells (E) in the IHC staining of xenograft tumors. Mean: bars ± SEM. n = 6 tumors in each group. * p < 0.05 with Student’s t-test.

