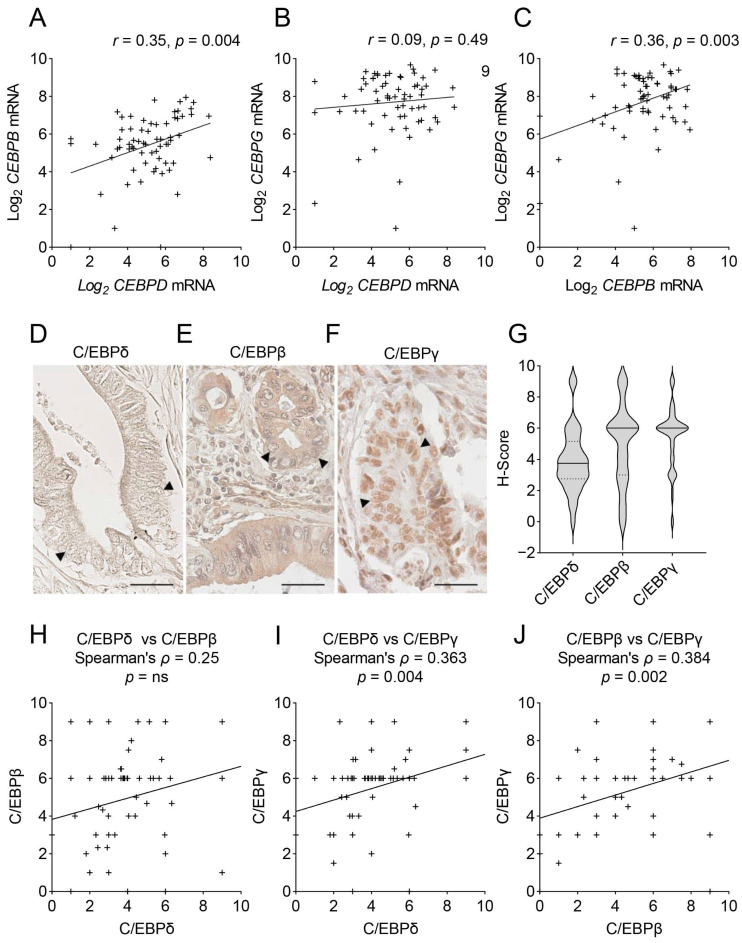
Figure 2.
Correlations of CEBPD, CEBPB and CEBPG mRNA and protein expression in PDAC. (A–C) Shown are XY-plots of the correlations of (A) CEBPD vs. CEBPB mRNA, (B) CEBPD vs. CEBPG mRNA and (C) CEBPB vs. CEBPG mRNA in the publicly available mRNA-sequencing dataset published by Renz et al. [24]. Denoted are the Pearson correlation coefficient (r) and the significance (p) of the correlation. (D–F) Immunohistochemical staining of C/EBPδ (D), C/EBPβ (E) and C/EBPγ (F) in PDAC tissues. Arrow heads mark tumor cell nuclei. Scale bars = 40 µm. (G) Shown are the distributions of H-scores for C/EBPδ, C/EBPβ and C/EBPγ in 68 PDAC cases. Dotted lines mark the upper and lower quartiles, full line marks the median. (H–J) XY-plots show the correlation of H-scores (as shown in Figure 2G) for all three proteins against one another. Denoted are Spearman’s correlation coefficient (ρ) and the significance of the correlation (p). ’+’ signs mark individual patients in XY-plots, ‘++’ indicates two patients with similar expressions. ns = not significant.

