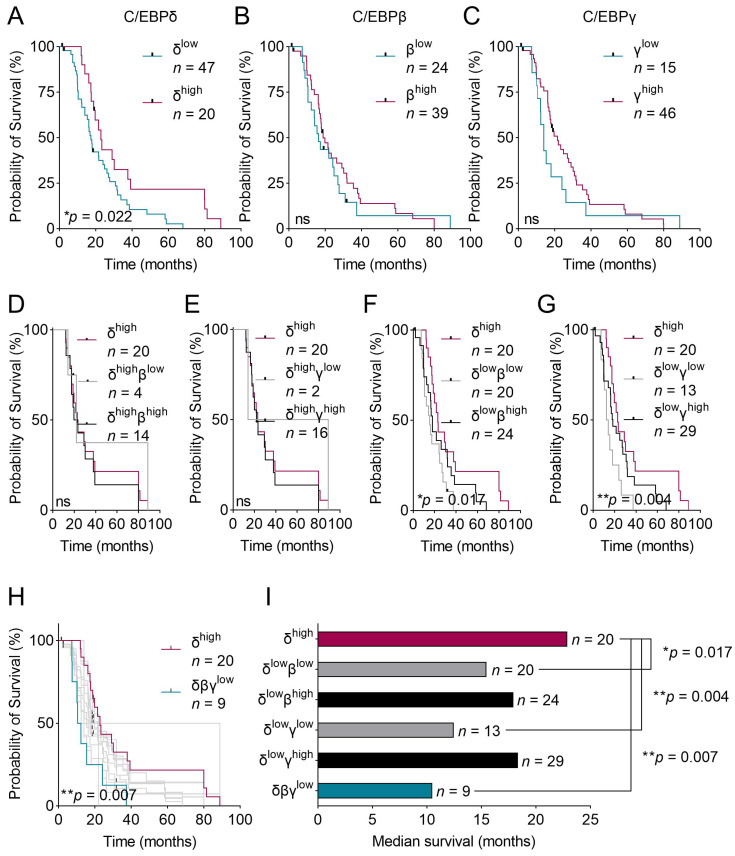
Figure 3.
Kaplan–Meier curves of patients expressing various levels of C/EBP-proteins and those combinations. (A–C) Kaplan–Meier curves of patients with either high or low expression of (A) C/EBPδ, (B) C/EBPβ and (C) C/EBPγ. (D–G) Kaplan–Meier curves of patients with high C/EBPδ (red curve) as well as patients with (D) high C/EBPδ with low C/EBPβ (gray line) and high C/EBPδ with high C/EBPβ (black line), (E) high C/EBPδ with low C/EBPγ (gray line) and high C/EBPδ with high C/EBPγ (black line), (F) low C/EBPδ with low C/EBPβ (gray line) and low C/EBPδ with high C/EBPβ (black line), (G) low C/EBPδ with low C/EBPγ (gray line) and low C/EBPδ with high C/EBPγ (black line). p-values correspond to the survival difference measured between patients with the best survival, i.e. high C/EBPδ (red line) and patients expressing low C/EBPδ with either low C/EBPβ (F) or low C/EBPγ (G) (gray lines). (H) Panel H combines survival curves of all patient groups discussed in panels (A–G). p-value compares the survival of patients with high C/EBPδ expression (red curve) with patients having low expression of all three proteins (turquoise curve). (I) Plotted is the median survival of the same patient groups as shown in panels (F,G) and of patients with low expression of all three proteins. Log-rank tests were used to estimate the effect of protein expression levels on survival. ns = not significant.

