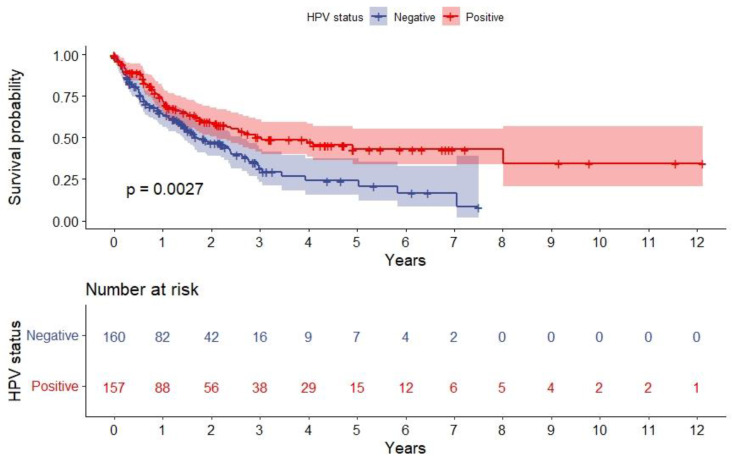
Figure 2.
Kaplan–Meier plot depicting overall survival after SPC stratified on HPV status. The red line shows patients with HPV+ OPSCC, and the blue line shows patients with HPV- OPSCC. The difference is significant (p = 0.003), tested with the log-rank method. Abbreviation: HPV, human papillomavirus; SPC, second primary malignancy.

