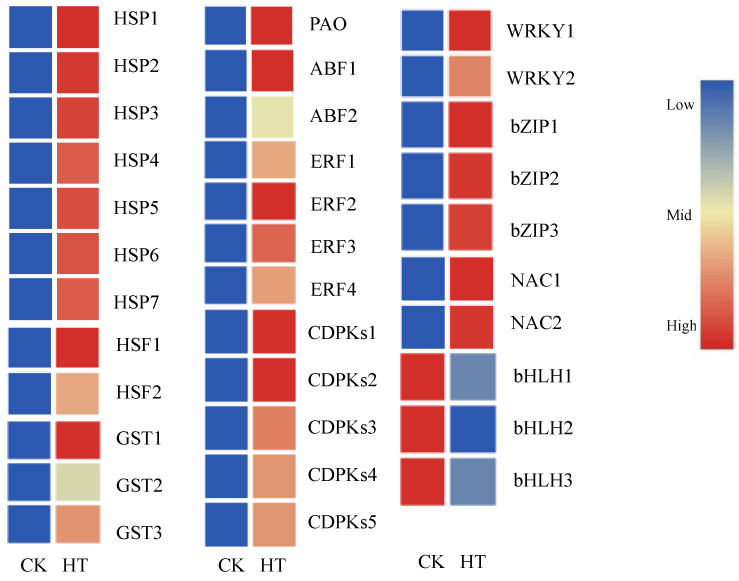
Figure 7.
Clustering of the differentially expressed genes related to the representative gene category in heat treatment compared with CK. Red color denoted genes with high expression levels, while blue color indicated genes with low expression levels. The relative expression levels of DEGs were calculated using the log2 ratio.

