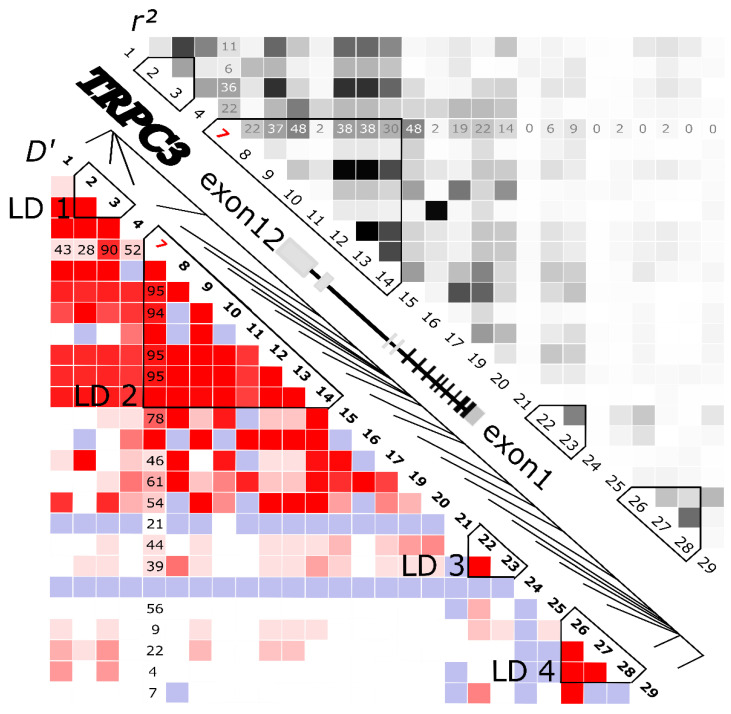
Figure 1.
Schematic representation of the TRPC3 gene structure and the LD. The gene structure of the TRPC3 gene is shown with exons 1–12. The four linkage disequilibrium (LD 1–4) blocks were generated from 29 SNPs using the LD statistics and HaploView. Linkage disequilibrium was measured using the D’ and r2 correlation coefficients and is displayed according to the standard color schemes for D’ (white: LOD < 2; D’ < 1; blue: LOD < 2; D’ = 1; shades of pink/red: LOD ≥ 2; D’ < 1; bright red: LOD ≥ 2; D’ = 1) and r2 (white: r2 = 0; shades of gray: 0 < r2 <1; black: r2 = 1). The D’ × 100 and r2 × 100 values of only the SNP pairs between rs11726196 (#7, red) and other SNPs are shown in each cell. Empty cells between these pairs of SNPs in the standard color scheme indicate D’ = 1. Red #7 indicates the tag SNP rs11726196.

