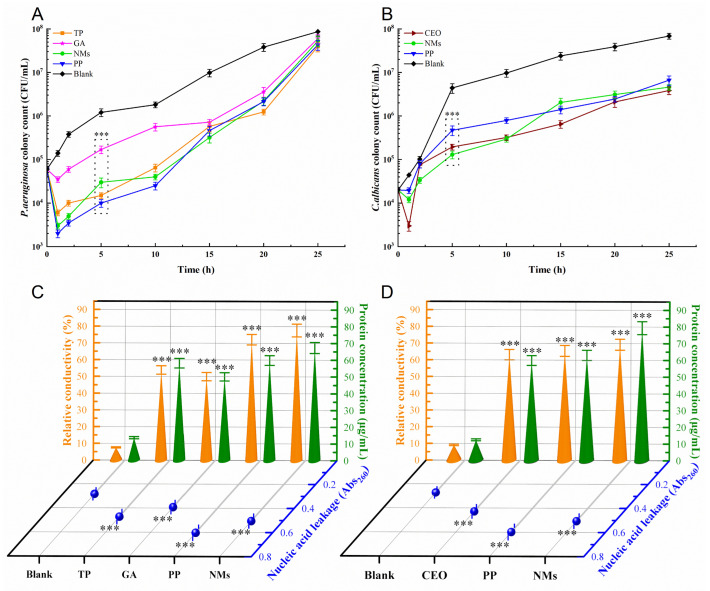
Figure 5.
Bacteriostatic mechanism data of NMs. (A) Growth curve of P. aeruginosa, (B) growth curve of C. albicans, (C) cell membrane permeability of P. aeruginosa, (D) cell membrane permeability of C. albicans. PP was selected as a positive control, and no bacteriostatic agent was selected as a blank control. Each value represents means ± SD (n = 3). *** indicates statistical difference at p < 0.001 level compared with blank group.

