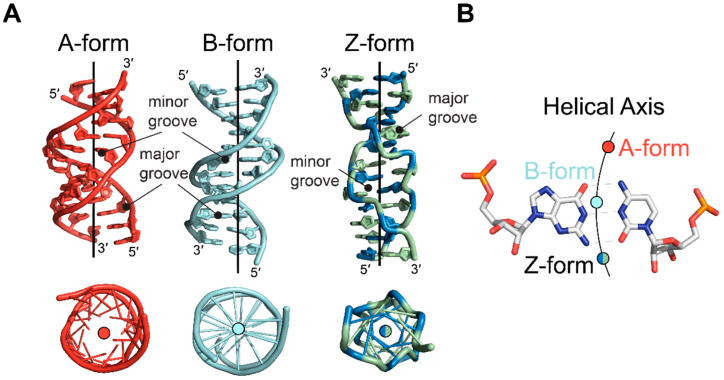
Figure 4.
Comparison of helical axes between A-, B-, and Z-form nucleic acids. (A) Side (top) and top-down (bottom) views of A-form (red, PDB: 413D [48]), B-form (cyan, PDB: 6CQ3), and Z-form (green and blue, PDB: 4OCB [49]) nucleic acids. Position of helical axes are drawn as a line for each structure. Below, the structures have been rotated to look down the center of the helix. (B) Positions of the helical axes relative to a G•C base pair for the A-form (red circle), B-form (cyan circle), and Z-form (green and blue circle) helices.

