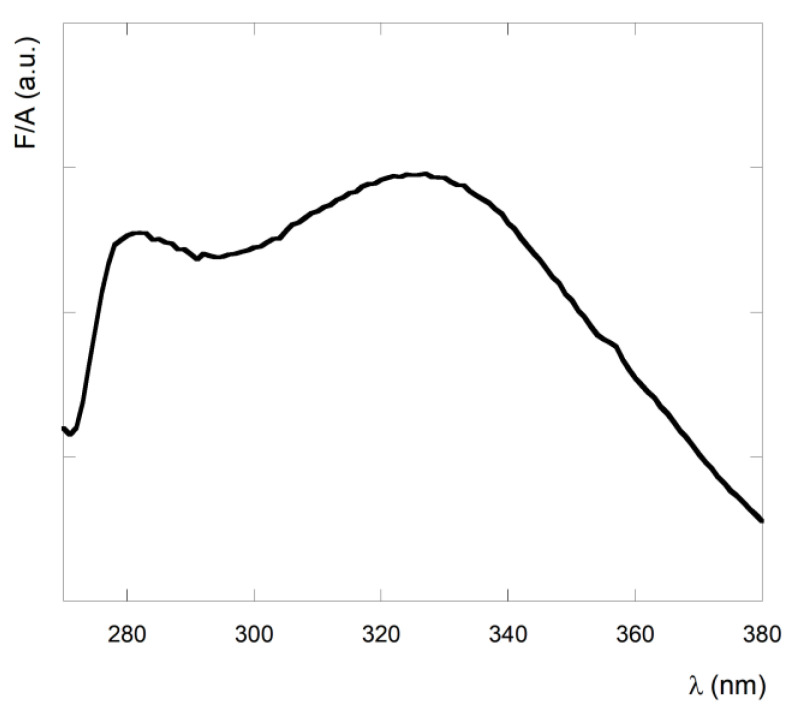
Figure 5.
Fluorescence spectrum of peptide 1 fibrillar nanostructures in CH2Cl2 solution at a concentration of 2.8 × 10⁻³ M. According to Ref. [61] the fluorescence emission spectrum of the filaments was obtained by exciting the sample at λex = 315 nm. Continuous line: fresh solution, dotted line: solution after ten days.

