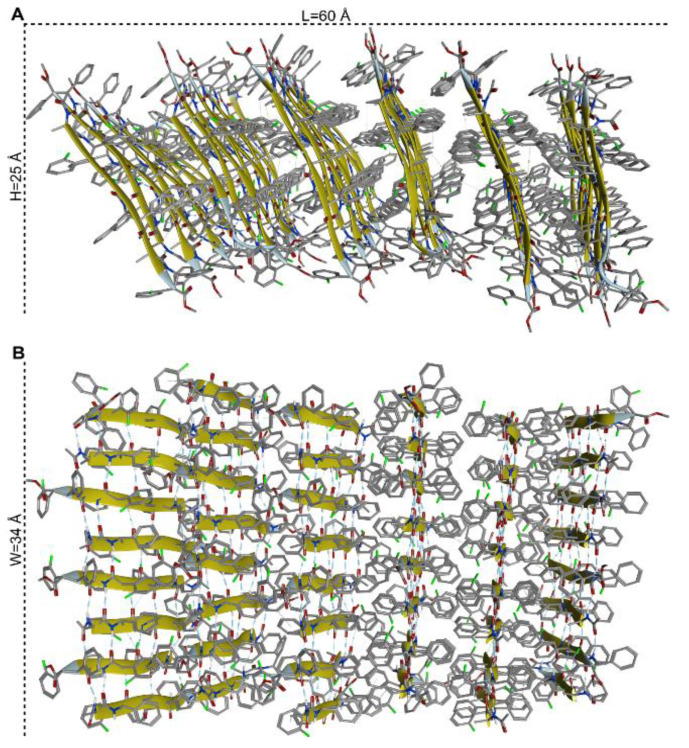
Figure 8.
Side (A) and top (B) views of the 6 × 8 assembly of model peptide 1. The geometry corresponds to the representative structure of the most populated cluster (population = 85%) obtained by cluster analysis of the last 400 ns of the 1 μs MD trajectory in explicit solvent. L is the average distance between the C-terminus of corresponding peptides in the first and the last β-sheet; W is the average distance between the C=O groups at the C- and N-terminal protections of the first and the last peptide within each β-sheet, while H corresponds to the average length of each peptide, as measured between the C=O groups.

