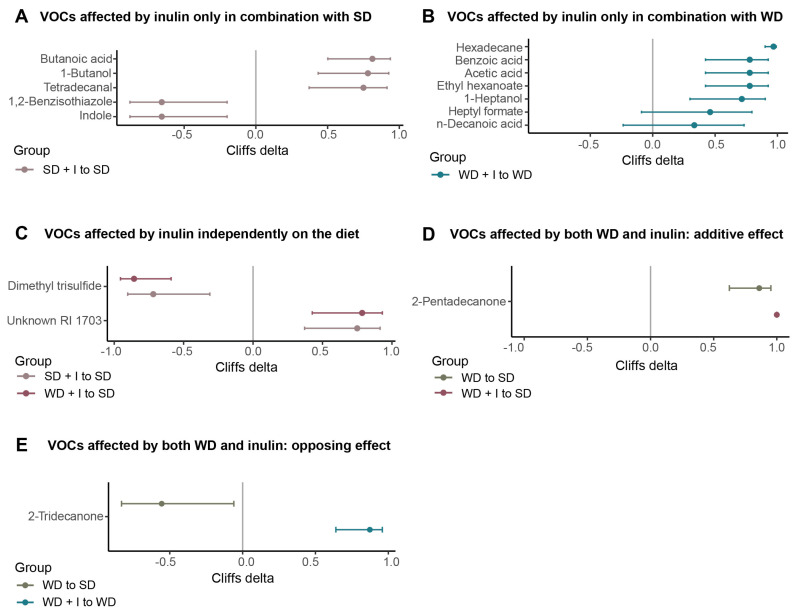
Figure 6.
VOCs significantly affected by diet and/or inulin. (A): VOCs affected by inulin only in combination with SD (adj_pval VG_SD + I vs VG_SD ˂ 0.1); (B): VOCs affected by inulin only in combination with WD (adj_pval VG_WD + I vs VG_SD ˂ 0.1); (C): VOCs affected by inulin independently on the diet (adj_pval VG_SD + I vs VG_SD ˂ 0.1 and adj_pval VG_WD + I vs VG_SD ˂ 0.1); (D): VOCs affected by both WD and inulin: additive effect (adj_pval VG_WD vs VG_SD ˂ 0.1 and adj_pval VG_WD + I vs VG_WD ˂ 0.1, effect size VG_WD vs VG_SD and VG_WD vs VG_WD + I in the same direction); (E): VOCs affected by both WD and inulin: opposing effect (adj_pval VG_WD vs VG_SD ˂ 0.1 and adj_pval VG_WD + I vs VG_WD ˂ 0.1, effect size VG_WD vs VG_SD and VG_WD vs VG_WD + I in the opposite direction). The VOCs were selected according to the outcome of the univariable statistic test (Kruskal-Wallis), omnibus adj_pval ˂ 0.1. The graph shows the effect size calculated as log2FC. adj_pval, adjusted p-value; FC, fold change; RI, retention index.

